Welcome to the first in our line of cryptocurrency trading guides where we will help you recognize, understand, and utilize various price movement indicators, patterns, and formations.
One of the most basic techniques in cryptocurrency trading is following moving averages and acting accordingly.
In the first guide, we are going to dissect the two basic kinds of moving averages:
- Simple Moving Average
- Exponential Moving Average
Also, we are going to show you how to utilize them for taking trading positions.
Simple Moving Average
Simple Moving Average or just the Moving Average (MA) is represented by a simple line that is moving in accordance with the cryptocurrency average price over a period of time. For example, if during a period of five days the closing price of a crypto asset was $2, $3, $6, $7, $5, the Moving Average is determined by adding all the numbers and dividing them by 5 (the number of days).
2 + 3 + 6 + 7 + 5 = 23
23 / 5 = 4.6
Therefore, the Moving Average line for those five days would be centered on $4.6.
The problem with such a simple calculation is that the highly volatile cryptocurrency market tends to have sudden surges and declines, and the Simple Moving Average can show an unrealistic representation of the market conditions.
For example, if during the same five days, prices close at $2, $3, $6, $20, $5, the Moving Average would be $7.2, which can mislead a trader as the realistic longer-term market conditions are far away from that price.
Using a Simple Moving Average
There are three most used Moving Averages that should be taken into account:
- 50-day average
- 100-day average
- 200-day average
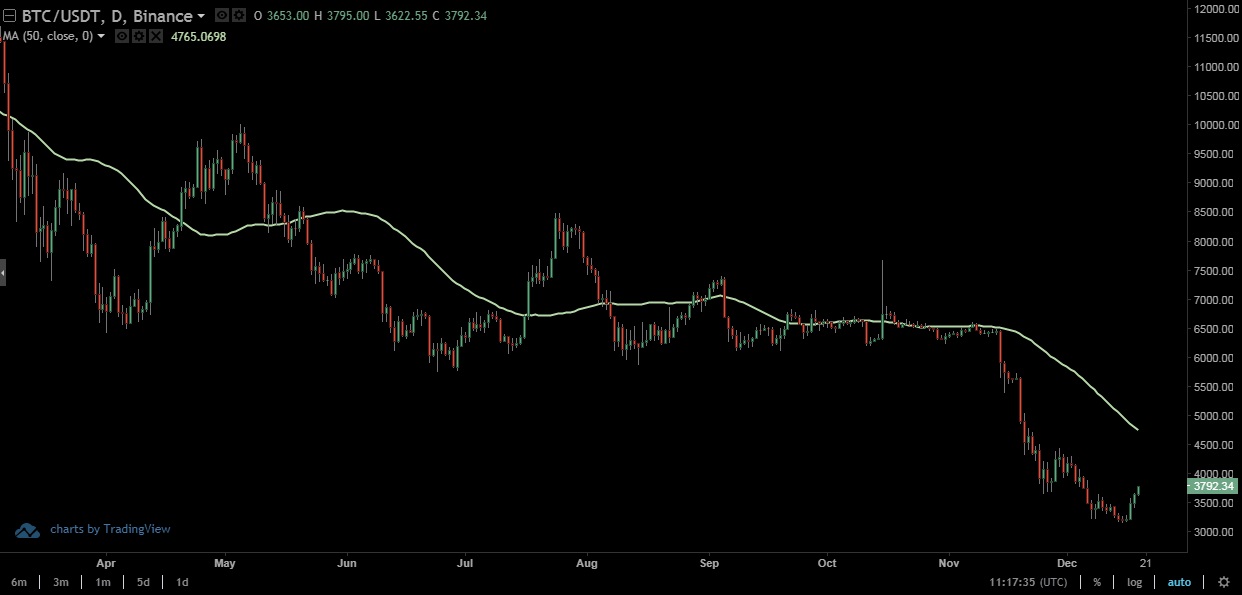
50-day average
This represents a short-term traders sentiment towards the market and will have more swings compared to the long-term averages.
If the price is above the 50-day average line, that means that the asset is trading in a short-term bullish market. If the opposite happens, traders are trading in a short-term bearish market.
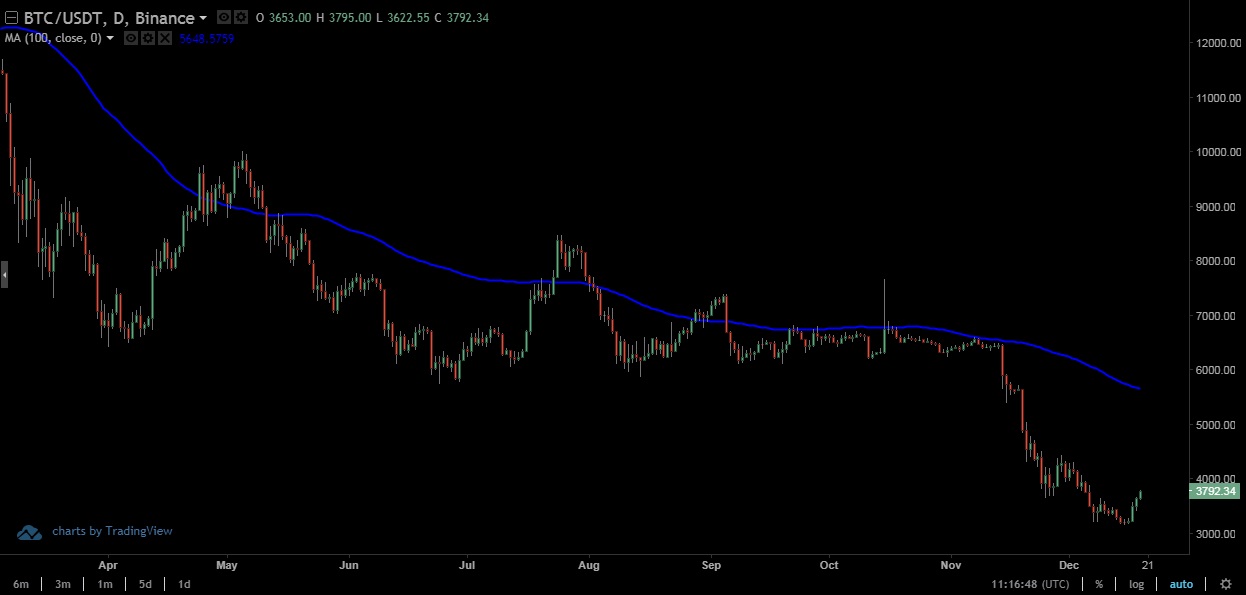
100-day average
Characterized by sharp reversals (compared to 200-day MA), the 100-day average may easily represent some large economic or political movements, such as new crypto-related laws brought by regulators of some big market.
The 100-day Moving Average is expected to travel in opposite directions to the 50-day average line.
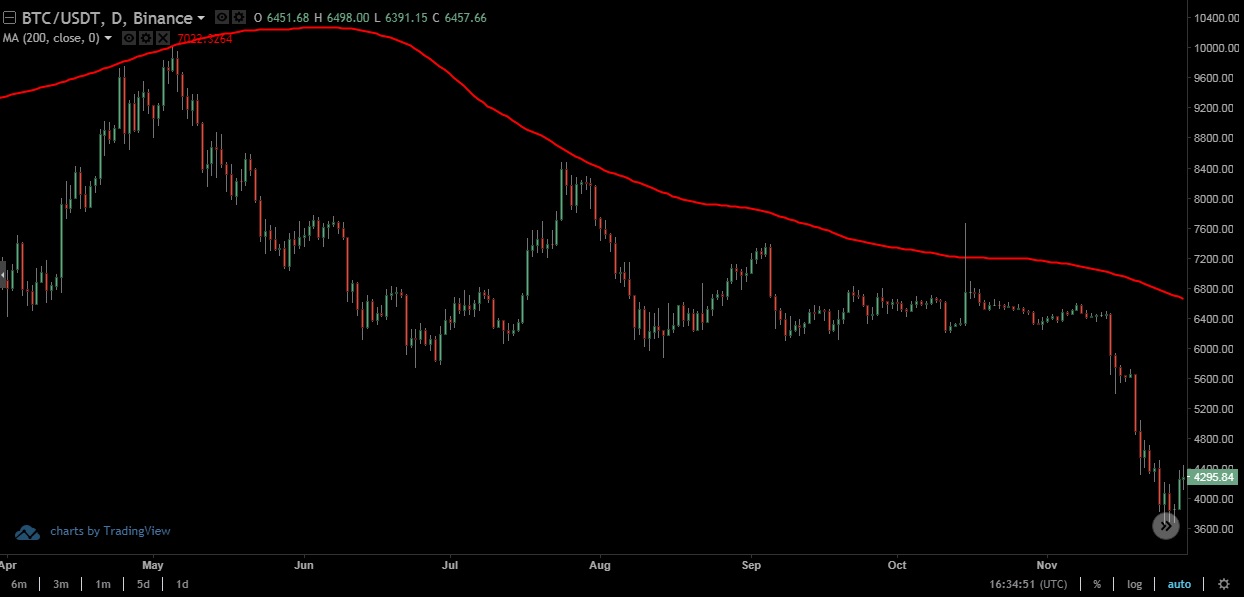
200-day average
The 200-day average will reveal the overall long-term market sentiment, and allow traders to see if their long-term position will pay off or if they should start thinking of exiting the market. Still, traders should not expect a 200-day average to reveal the best entry/exit prices, as it is far too distanced of what is going on in the market at the moment.
However, combining Moving Averages, especially in day-trading, can be crucial for traders’ decision-making process, and for taking the most profitable positions. That brings us to the Golden/Death Cross “indicator”.
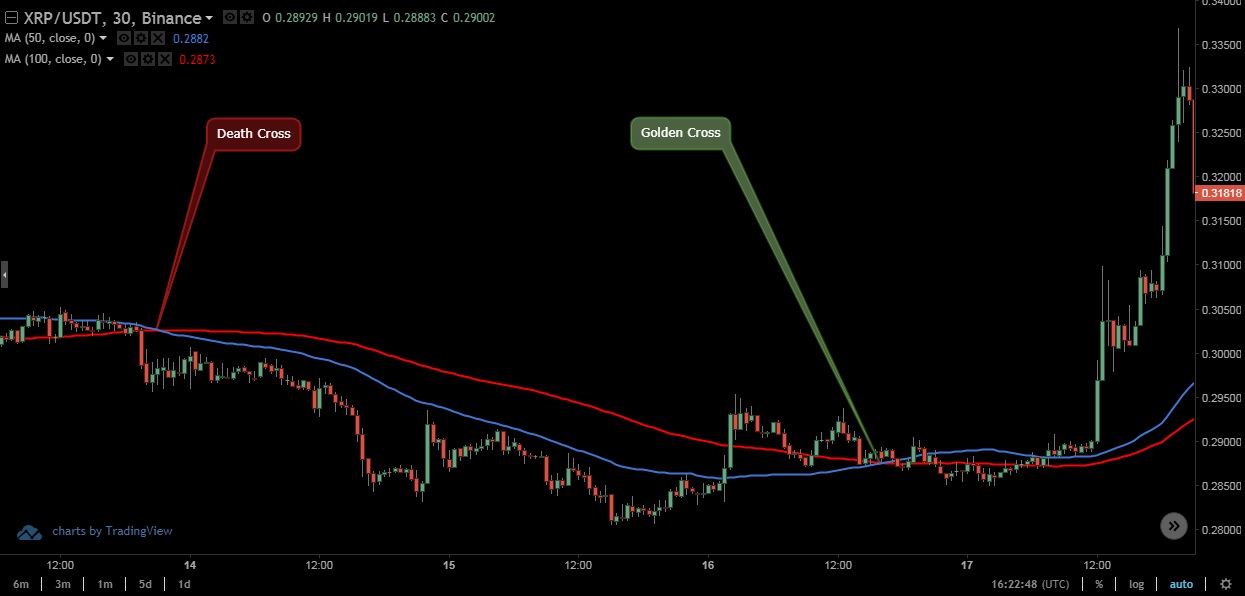
The Golden Cross and the Death Cross
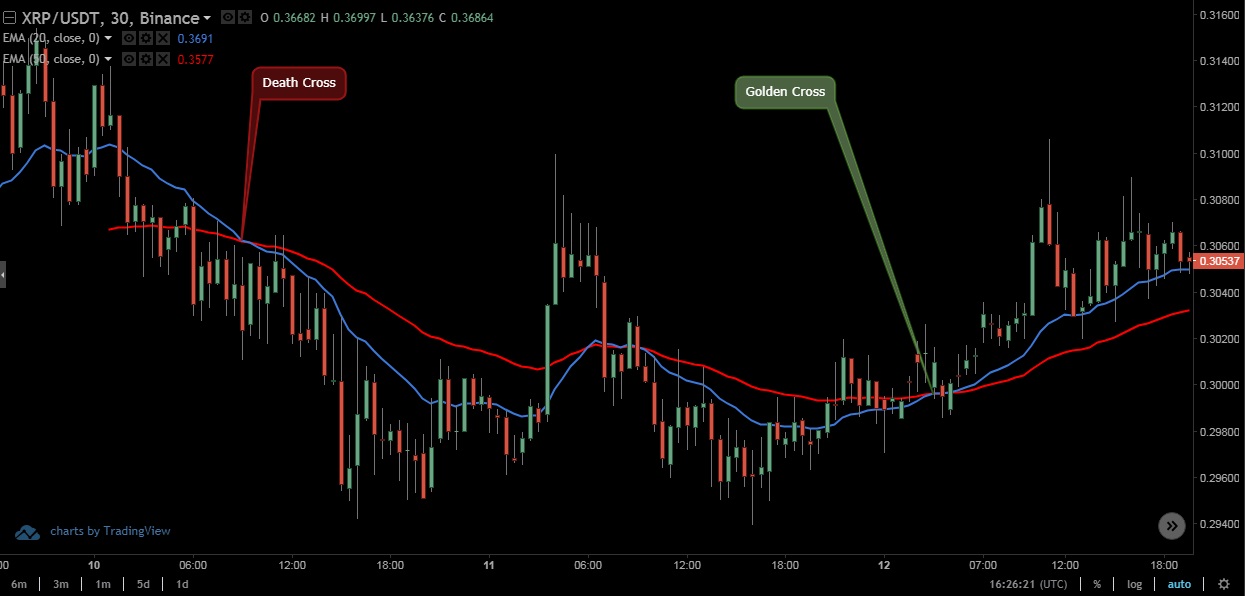
The Golden Cross is the position in the market when a short-term Moving Average line crosses above a longer-term Moving Average line, indicating a good entry point. Simply put, if a shorter-term Moving Average line goes up and crosses over a longer-term Moving Average, it can be considered as a buy signal.
If the opposite happens, short-term Moving Average cross below long-term Moving Average, it is called the Death Cross, and it means that the market’s bears are set to return and traders should consider selling their cryptocurrency.
Exponential Moving Average
As we mentioned, Simple Moving Average can be misleading for short-term traders as it doesn’t realistically represent the market situation due to its simplicity. Therefore, we have the Exponential Moving Average (EMA).
The EMA is determined by the rather complicated mathematical equation, and deals with more recent price movements, making it easier for traders to better understand the price movement and to make a more educated decision. The EMA gives a higher weighting to recent prices, while the MA assigns equal weighting to all prices.
Exponential Moving Average is mostly used by swing and day-traders, who use shorter timeframes to place trade orders, such as 5-day, 10-day, 20-day, and 50-day EMA. The chart below shows the classic combination of 20-day and 50-day EMA to deduce the right entry/exit positions.
Knowing how to utilize Moving Averages is a good start for your career as a cryptocurrency trader. Still, there are many more trading techniques a trader should be familiar with to be successful.
Traders can always utilize Coinalyze detailed technical analysis (Bitcoin) and cryptocurrency live prices to devise even better trading strategies.
Until the next part of our tutorial, trade responsibly.
Disclaimer: This article is not investment advice. Note that cryptocurrencies are highly volatile assets and very risky investments. Do your research or consult an investment professional before investing. Never invest more than you can afford to lose. Never borrow money to invest in cryptocurrencies.