In the cryptocurrency market, derivatives trading is becoming more popular than ever. Therefore, to make our traders’ lives easier, Coinalyze added some new indicators to the charts. Among the most important is definitely Open Interest. What is open interest and how to use it in derivatives trading is the thing that we are about to explain.
What is the Open Interest Indicator?
Open Interest (OI) is an indicator that reveals the number of open contracts in a particular market. However, traders should not mix it up with trade volume.
This means that, when a buyer and a seller reach an agreement, the contract is made and it gets recorded in the OI indicator. That contract remains a part of the OI reading until the closure or liquidation. In the meantime, the buyer and seller can do whatever they wish with the contract. They may even sell it further on. Regardless of their other actions, that single contract remains recorded.
Therefore, rising OI reveals that new money is being pumped into the market. On the other hand, a declining OI indicator shows that the market is losing funds.
There lays the difference between volume and OI. While all other actions besides contract signing and closure get recorded in the volume indicator, that isn’t the case with OI.
What is Open Interest Good For?
By itself, OI does only what we previously described. However, in combination with buy/sell volume traders can find on Coinalyze, it reveals a lot more.
Here are a few models.
Open Interest With Buy/Sell Volume
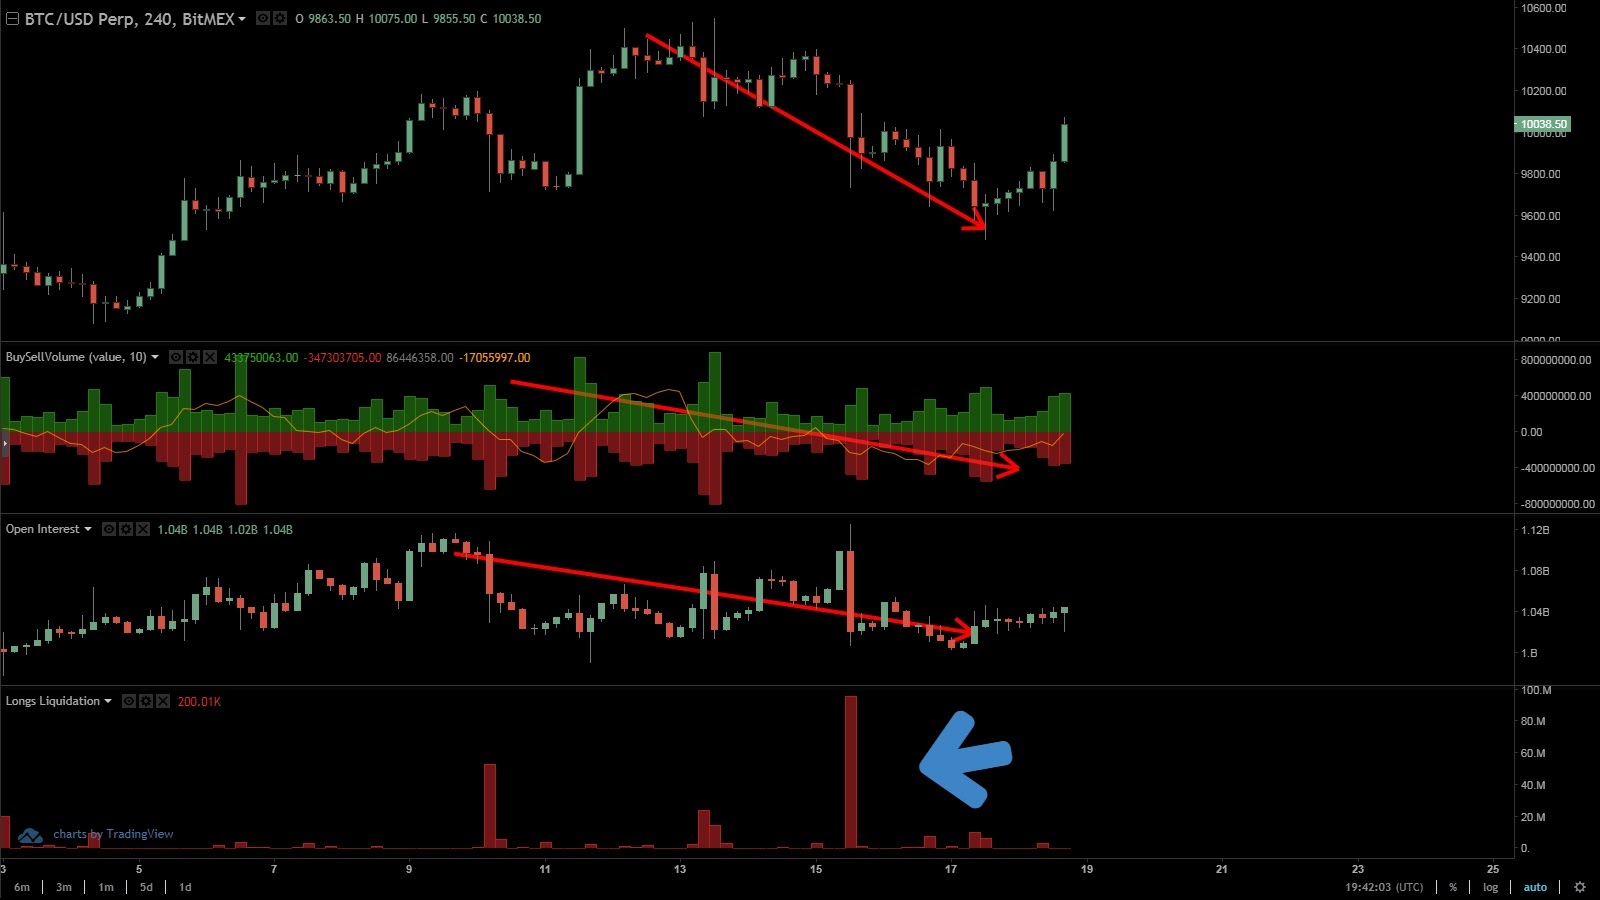
Say that the OI indicator drops, and the buy/sell volume reading reveals the overwhelming selling wave, this means that traders are closing their long position contracts. Therefore, in the close future, the price is likely to decline. It is at times like these that we can expect to see a lot of longs liquidations.
Below, we are showing one such example in a 4hr BitMEX BTC/USD chart. The declining Open Interest along with the high sell volume pushes the price down. As a result, liquidation sweeps away almost 100 million worth of long contracts in only 4 hours.
On the other hand, if the OI rises and there is an overwhelming buying volume, traders are making new long position contracts. Therefore, the price is likely to go up.
These are two of the most simple patterns. However, other, slightly more complex scenarios are possible.
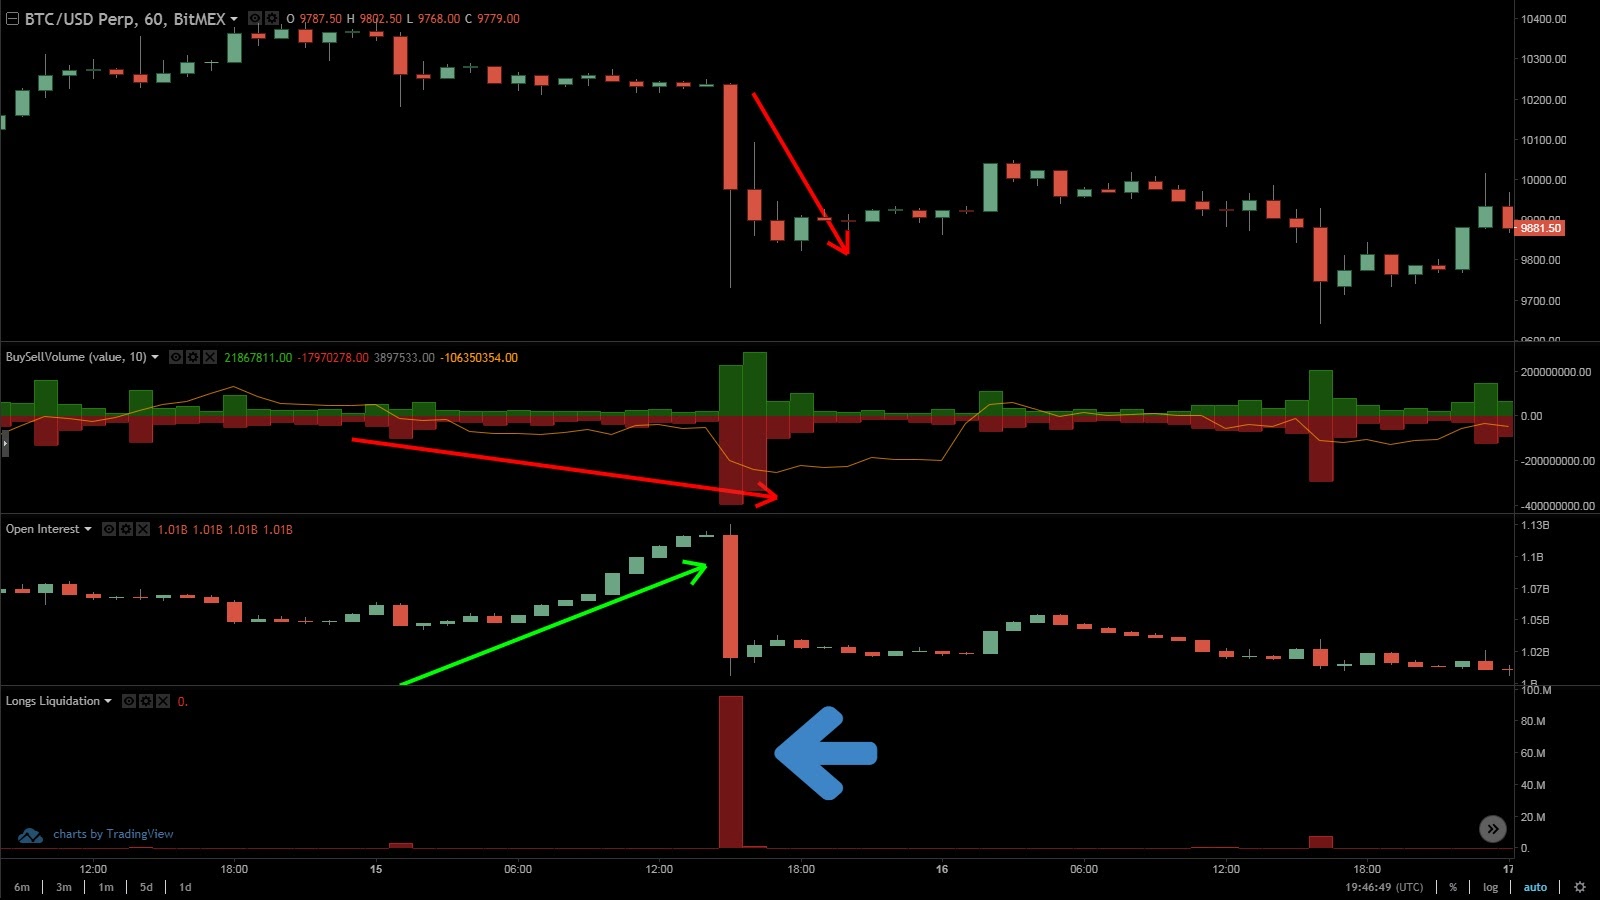
For example, let’s say that the OI rises but the sell volume is larger than the buy volume. This means that there are more traders opening short positions than those who are going long. While this may not be the case every time, it is highly probable that, in this case, the price is going to decline.
One such example is visible in the chart below. The rising OI reveals the influx of new money in the market. However, traders are making short contracts, which is depicted by the buy/sell volume indicator. As a result, the price plummets and 100 million longs get liquidated.
Open Interest Indicates the Trend Continuation or Reversal
As we already stated, Open Interest clearly depicts the amount of cash flowing into or out of the market. Therefore, some traders believe that, by analyzing OI, they can predict market movements.
For instance, if the chart reveals the rise in Open Interest, this means that the fresh influx of funds is underway. Consequently, the current market trend is most probably going to continue.
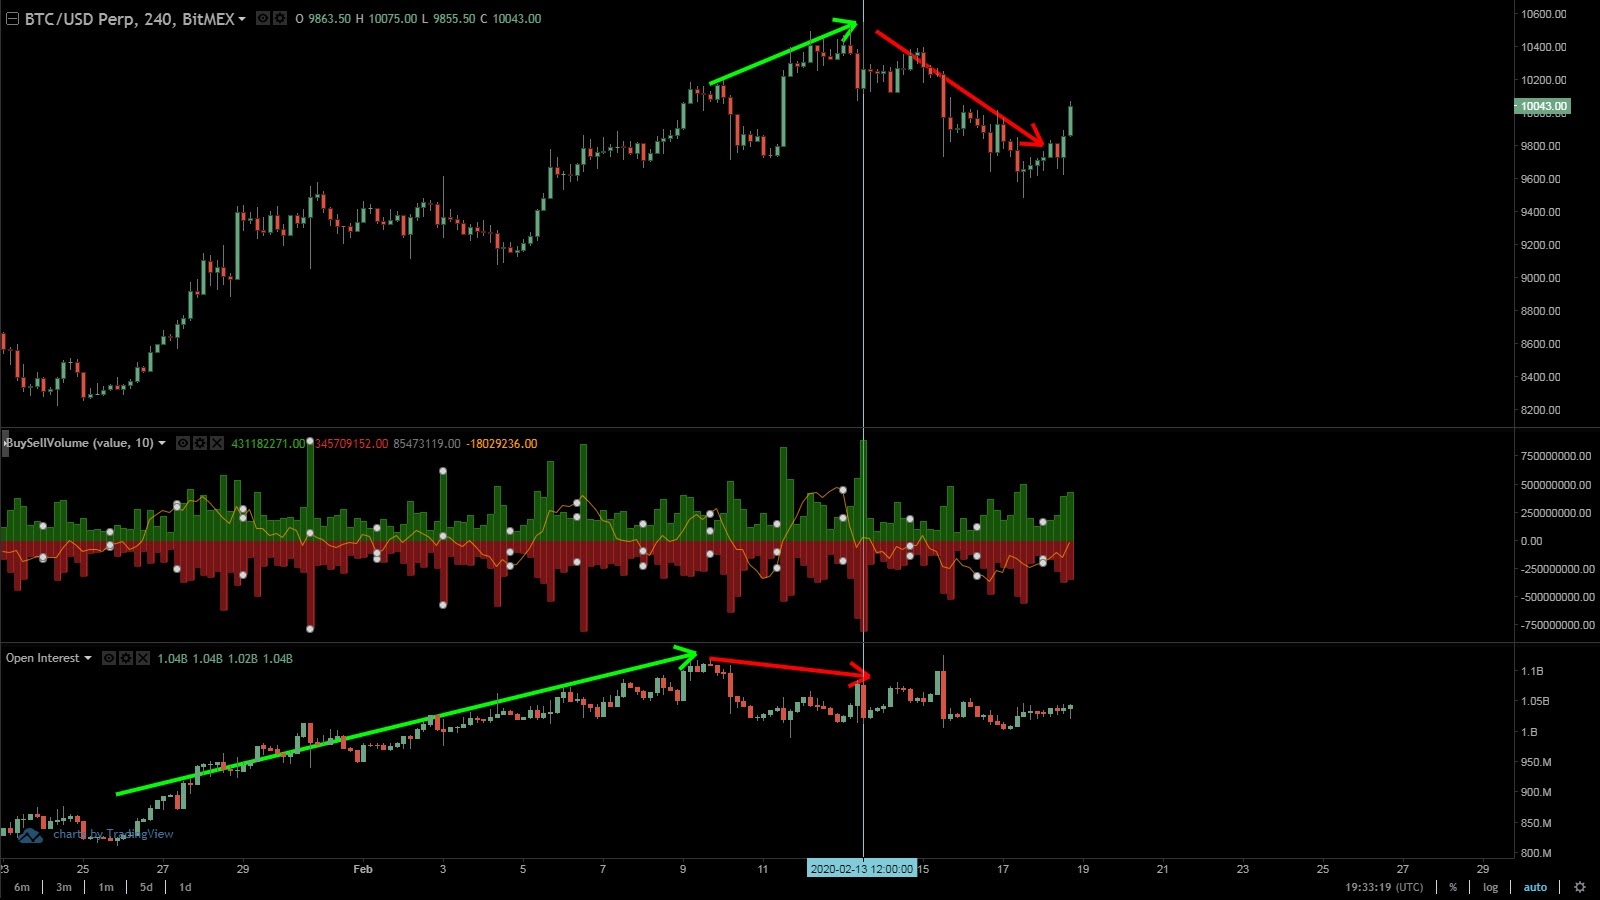
On the other hand, the declining Open Interest may foreshadow the trend reversal since the new money simply isn’t there to support it. The best example is the BitMEX perpetual 4-hour BTC/USD chart below. For a while, the Open Interest follows the trend. However, at one point the OI starts decreasing. The price still rises for a short time. However, the trend cannot keep up without fresh money. Therefore, as a result, the trend reverses (the light-blue vertical line).
Open Interest and Liquidations
Perhaps you have already noticed that we have mentioned liquidations in correlation with OI a few times. That is because they are, in a way, related.
Every liquidation removes the contract from the market. Therefore, the Open Interest indicator declines with every liquidated contract. The more contracts get liquidated, the more rapidly open interest declines.
This doesn’t have anything to do with these contracts’ positions being long or short. If shorts get liquidated, the OI is also going to decline just like it is the case when this happens to longs. Therefore, when trading in accordance with the Open Interest indicator, our recommendation is not to pay much attention to candle spikes but to the overall trend instead.
Here is one perfect example of what we are talking about:
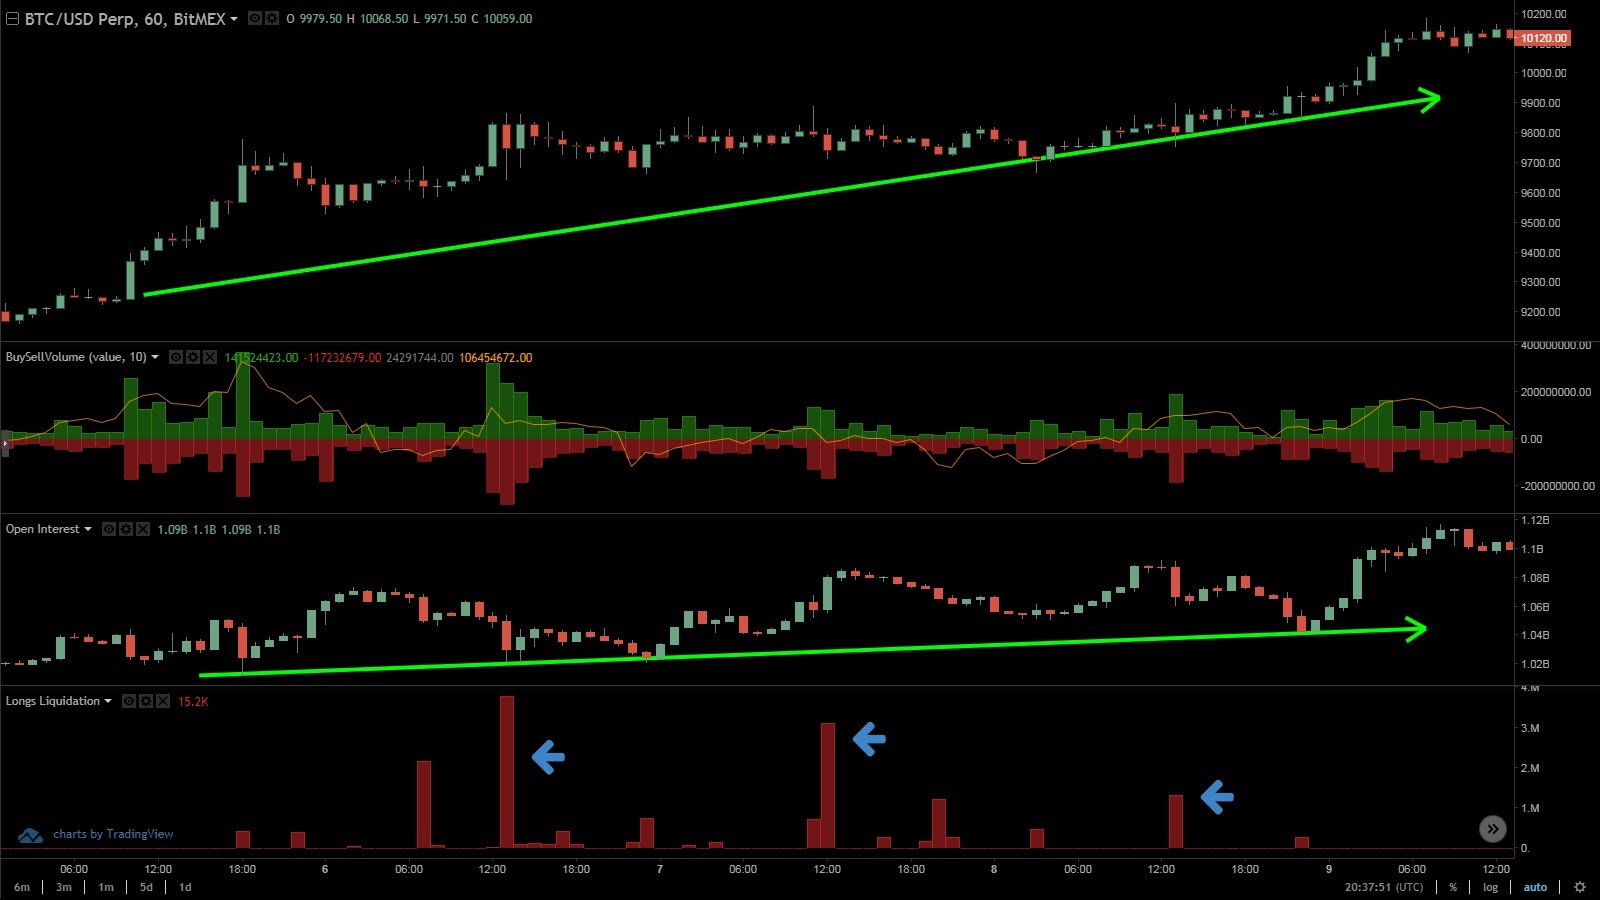
During the span of 3 days visible in the chart below, liquidation closed approximately 40 million contracts. Each liquidation correlates to a longer candle in the OI indicator. Nevertheless, the overall price trend is positive and so is the Open Interest. This means that the trend is likely to continue, and an experienced trader will take a long position.
Conclusion
Just like any other indicator, Open Interest is most useful in combination with other readings. In this case, Coinalyze’s exclusive buy/sell volume indicator. Also, when analyzing trends, it is always a good idea to use some additional indicators such as MACD and RSI to look for divergences.
In the end, please note that, nowadays, traders are using insane leverages in the cryptocurrency markets. This leads to a lot of liquidations. Therefore, the number of liquidations may not represent a clear picture of the market’s wide-scale ongoings.
Hence, always trade responsibly and try to learn as much about the technical analysis as possible.
Disclaimer: This article is not investment advice. Note that cryptocurrencies are highly volatile assets and very risky investments. Do your research or consult an investment professional before investing. Never invest more than you can afford to lose. Never borrow money to invest in cryptocurrencies.