When trading cryptocurrencies by using technical analysis, traders use many different indicators, and among the ones that are most important is the Relative Strength Index (RSI).
We can say that RSI is a momentum indicator that gives us a clear picture if a cryptocurrency is overbought or oversold. It is depicted as an oscillator below the trading chart, which has values between 0 and 100 and moves between those two extremes.
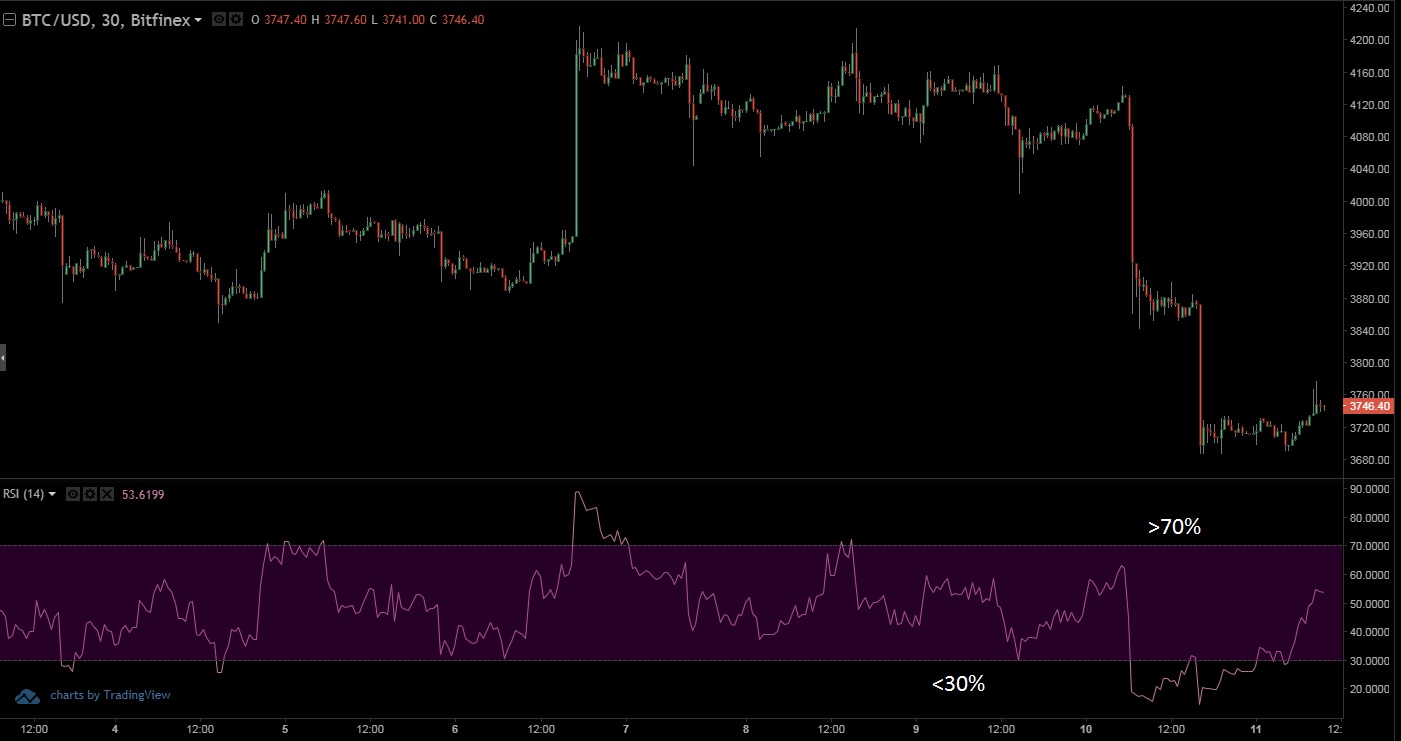
For a cryptocurrency to be considered overbought according to the RSI, the oscillator has to surpass the 70% mark, as shown in the picture below. For an asset to be considered oversold, the same oscillator has to drop below 30%.
Is it so simple?
Well, yes and no.
While the reading may appear as a simple one, in fact, the RSI indicator uses a mathematical formula to calculate the average.
The basic one calculates a rough average movement of the price of cryptocurrency in accordance with the average positive and negative trade closures during a certain period of time, and looks like this:
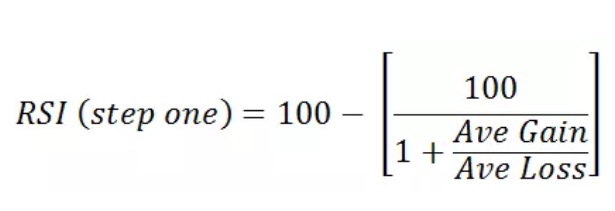
Source: Investopedia
Since the common standard is to use 14 periods, the formula uses positive and negative average percentages through that period of time in accordance with that standard. So, for example, if we had 7 gains with an average of 1% and 7 losses with an average of 0.8%, the formula would look like this:
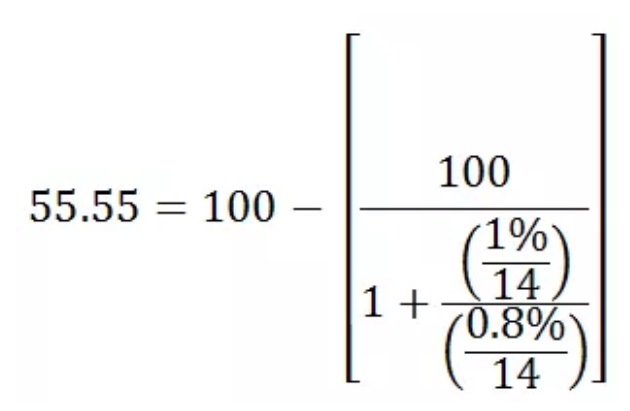
Source: Investopedia
The next part of the calculation is used to “smooth out” the result so the oscillator will only reach extreme values in cases of extreme market conditions when the price of a cryptocurrency is highly inflated or it is experiencing a serious sell-off:
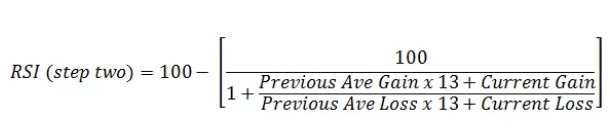
Source: Investopedia
How to trade using the RSI
There are two ways that traders use RSI to trade:
- Divergences
- Swing rejections
Divergences
Divergence occurs when price move downwards while RSI move upwards, or vice versa, price move upwards while RSI move downwards.
For example, in the bullish divergence, RSI makes higher lows while price makes lower lows ( as can be seen in the BTC/USD chart below), which clearly signals the reversal of the trend. The chart also shows how the Bitcoin price hits the lowest value exactly as the RSI reaches higher low, announcing that the price is very likely to go bullish.
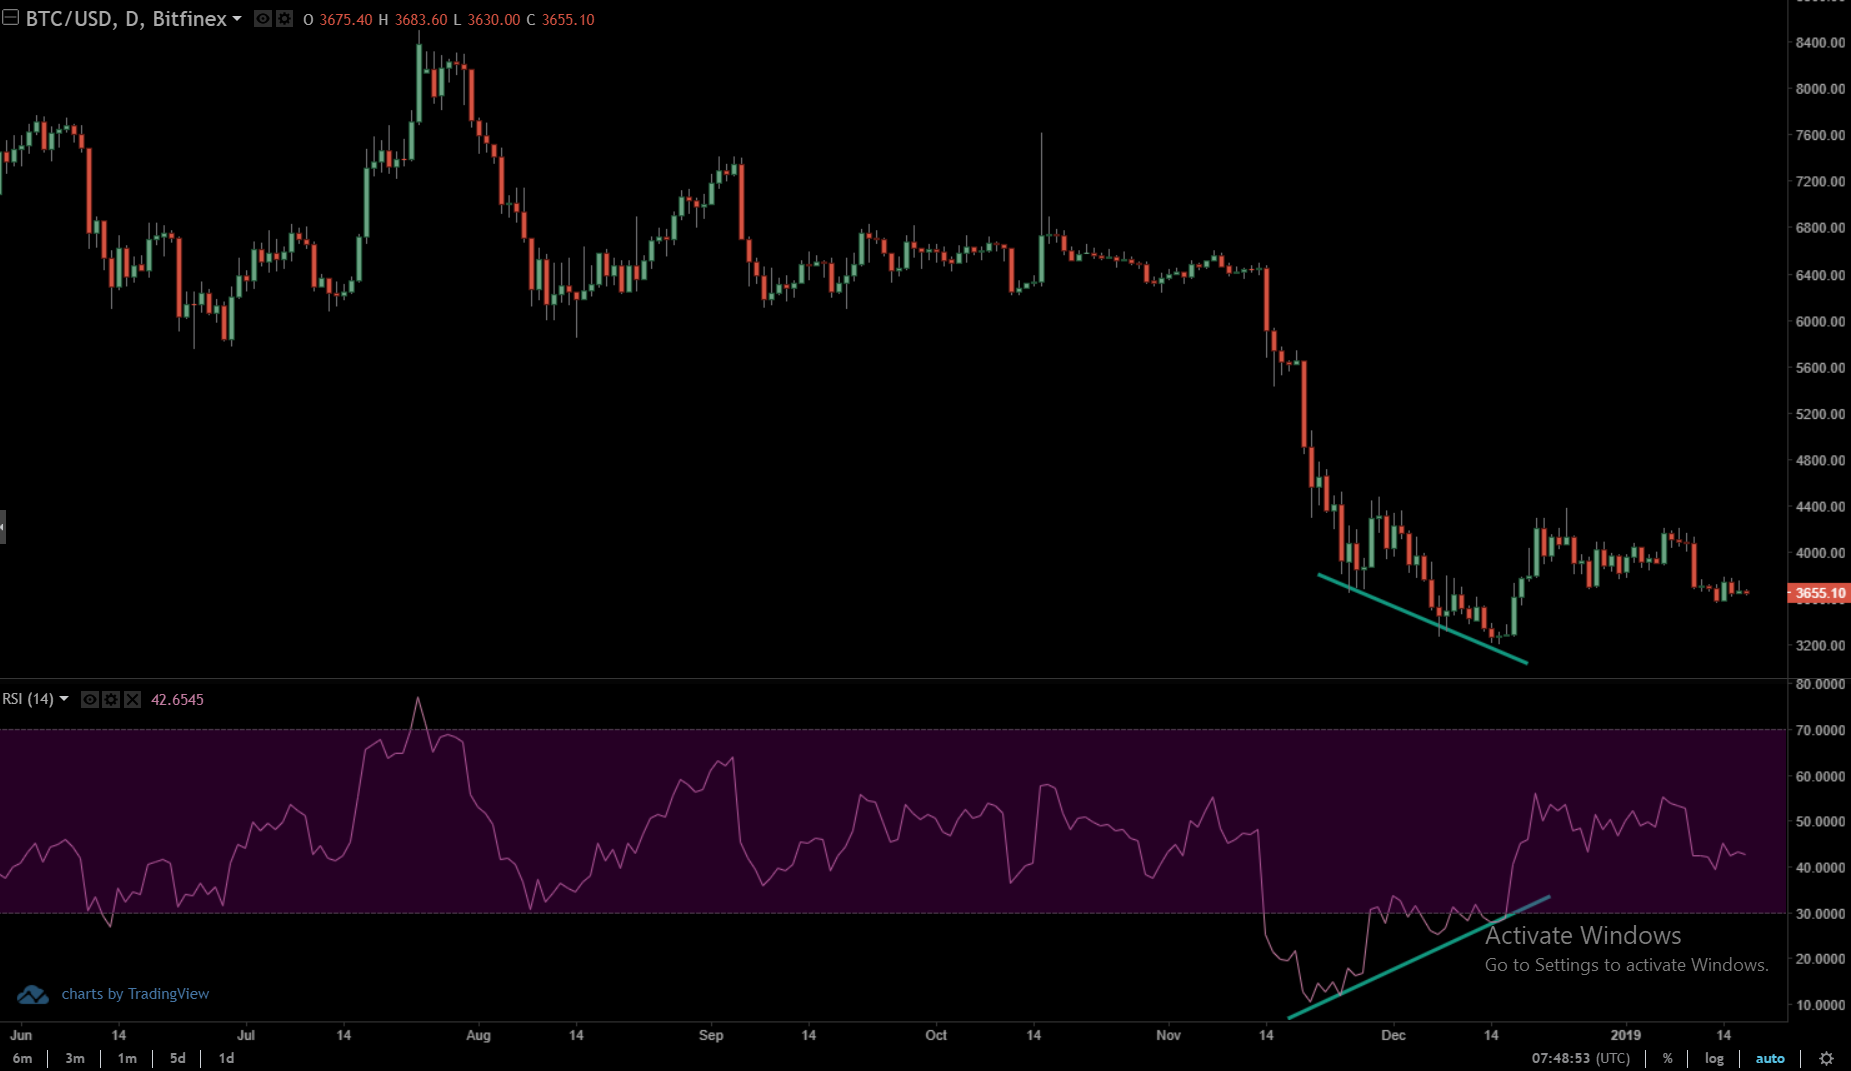
Naturally, bearish divergence can be detected by exactly the opposite oscillator movement.
However, there are periods when the market doesn’t show such extreme movements and is in a horizontal trading line with minimal oscillations. It is in those time a trader has to use the flexible oversold and overbought studies which will help identify useful signals.
Swing rejections
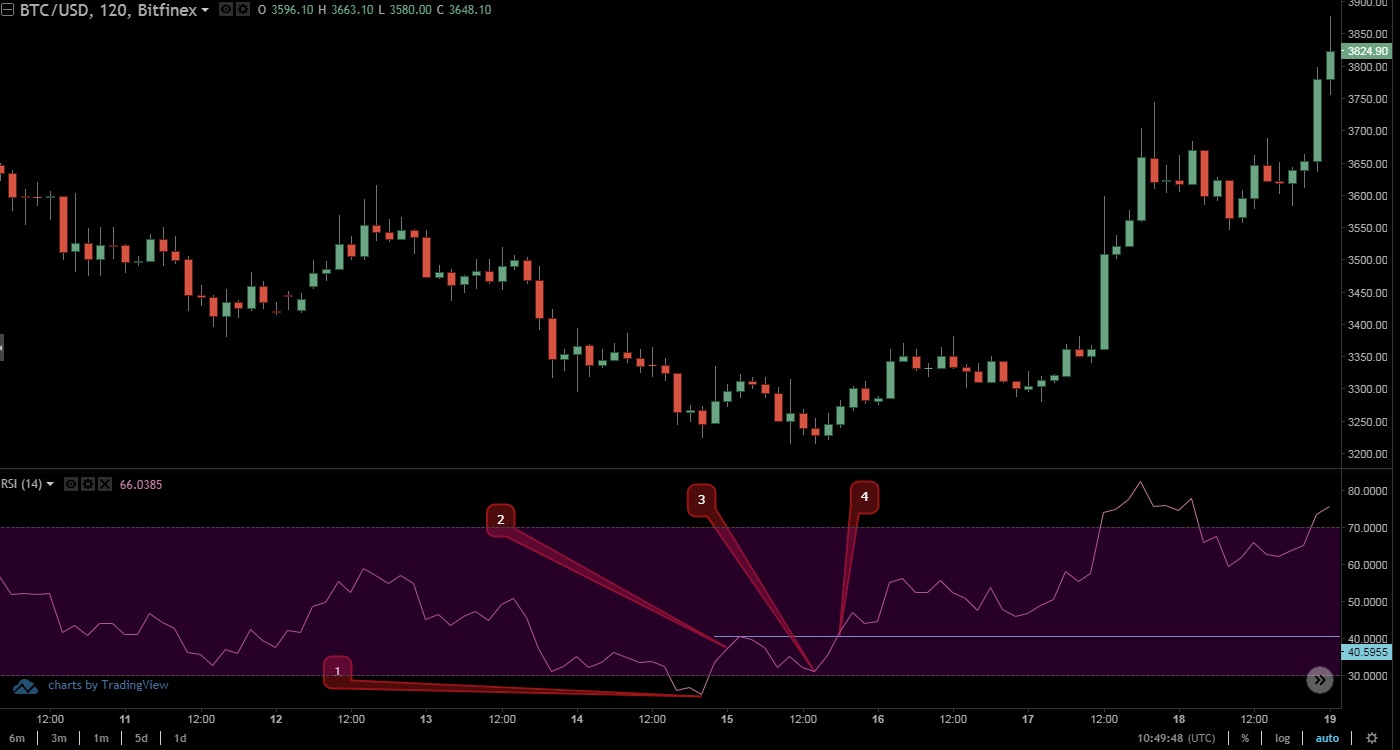
Swing rejections are another way of utilizing RSI in crypto trading. Every swing rejection has four points traders have to keep in mind when detecting a reversal in this way. In case of a bullish swing rejection:
- RSI oscillator drops under the mentioned 30% barrier
- RSI crosses back above 30%
- RSI dips again, this time without crossing back into oversold territory
- RSI then breaks towards the most recent high
The bullish version of the swing rejection with all four phases can be clearly seen in the BTC / USD price chart below:
Bearish swing rejection is the opposite of its bullish counterpart and marks a negative reversal of the trend.
Stuck in the middle
As mentioned, the RSI readings don’t have to always hit extreme values, but there are those who use a 50% line to deduce the price movement and overbought or oversold levels.
Also, the price of the cryptocurrency can easily grow without reaching the 70% overbought mark. As can be seen in the chart below, the price of Bitcoin shows a steady growth despite the RSI oscillator traveling slightly above 50% line.
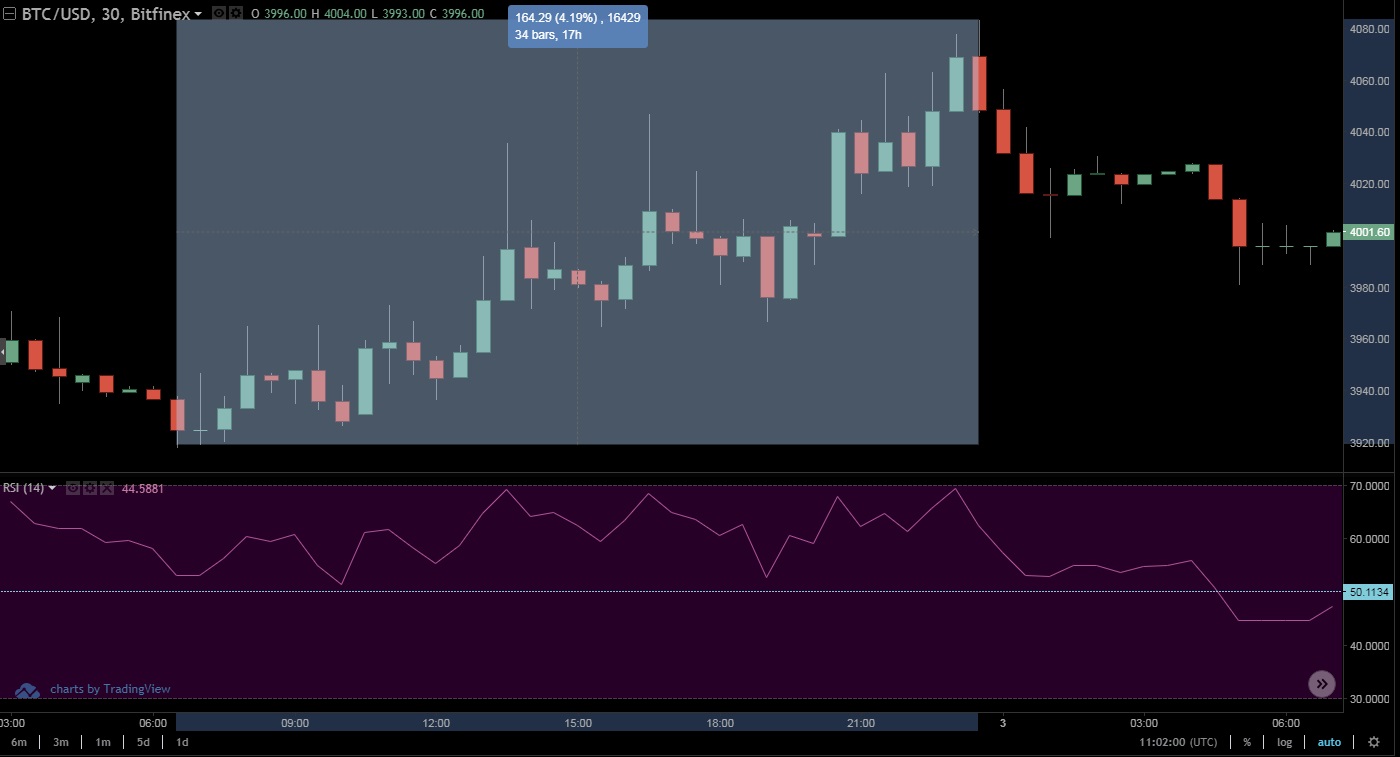
However, in this case, it will be much harder to detect a trend reversal than in the case when the RSI reaches the overbought and oversold values.
RSI is a useful tool for a successful trader, but when trading it is best to combine various techniques to reach more educated conclusions and take optimal trading positions.
Until the next part of our tutorial, trade responsibly.
Disclaimer: This article is not investment advice. Note that cryptocurrencies are highly volatile assets and very risky investments. Do your research or consult an investment professional before investing. Never invest more than you can afford to lose. Never borrow money to invest in cryptocurrencies.