One effective way to determine trends in cryptocurrency trading is by looking into technical indicators. All technical indicators are, in fact, mathematical calculations which are taking into account some market events to help traders predict trends and trend reversals.
Knowing your trend indicators is a great way to start trading cryptocurrencies. However, sometimes, combining the indicator readings will prove to be of the utmost importance when making trading decisions.
In order to help you better understand the six most important technical indicators, we will introduce you to every one of them and describe how to use:
- Moving Averages (MA)
- Relative Strength Index (RSI)
- Stochastic Oscillators
- Moving Average Convergence Divergences (MACD)
- Average Directional Indexes (ADX)
- On-Balance Volume (OBV)
Moving Averages (MA)
Moving averages are represented by a line which follows the cryptocurrency’s average price over a certain, predetermined period.
There are short-term and long-term MAs, which are utilized by traders according to their needs:
- 50-day average
- 100-day average
- 200-day average
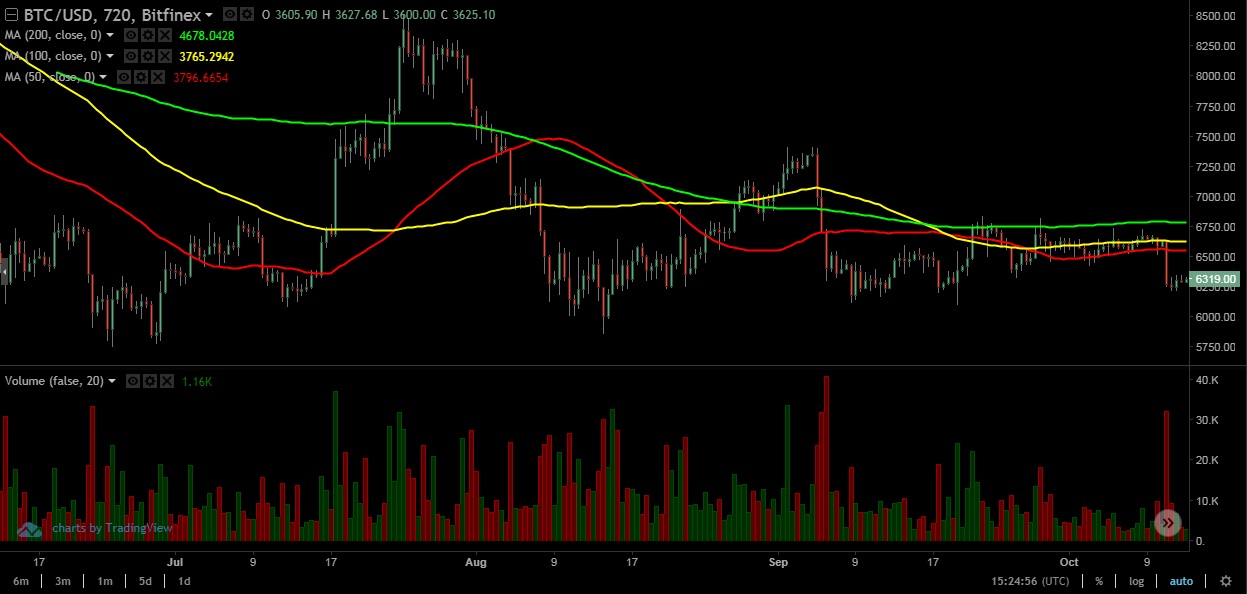
As it can be seen in the chart above, 50-day average (red) swings wildly along with the Bitcoin price (BTC), while a 100-day average line (yellow) reacts much slower and, therefore, sometimes travels in the opposite direction of its shorter-term counterpart.
The 200-day average (green) shows hardly any vertical movement while slowly declining horizontally, indicating that despite all the swings caused by the high volatility, investors’ sentiment towards Bitcoin still remains bearish.
Each of these averages is hard to utilize individually, but combining the readings can give us the idea of possible trend reversals. The same chart clearly shows that these trend lines tend to sometimes cross each other. These events, depending on their nature, are called golden or death crosses.
Golden/Death cross
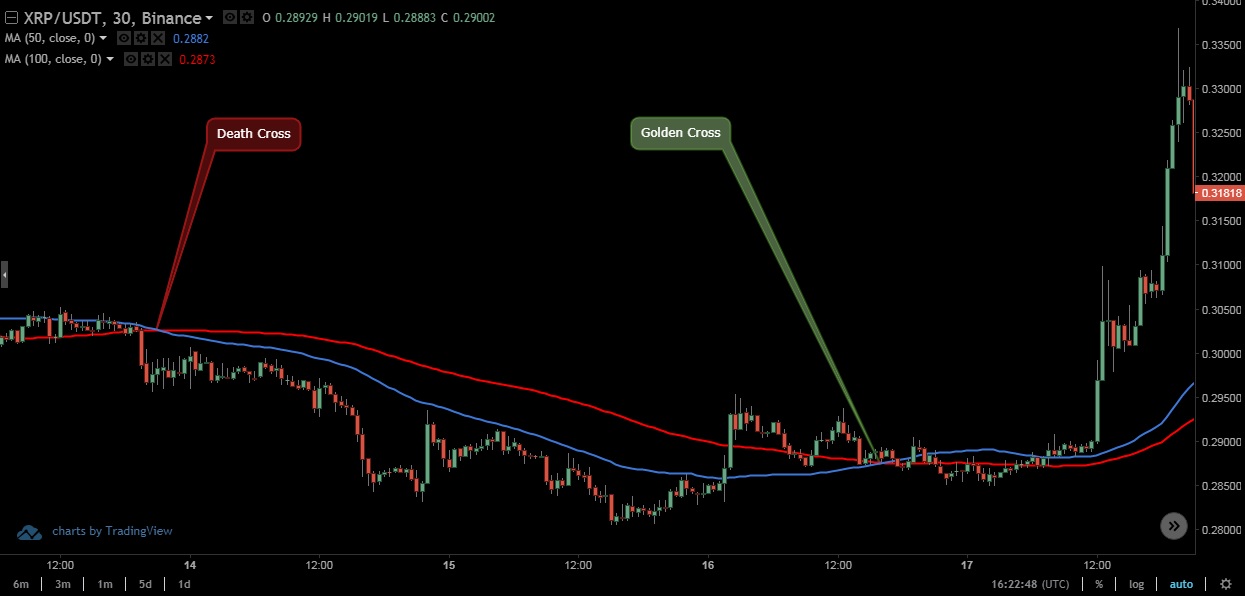
The Golden Cross happens when a short-term MA crosses above its longer-term counterpart, which is considered to be a buy signal.
On the other hand, a Death Cross happens when exactly the opposite happens, and the short-term MA crosses below the longer-term MA. When that happens, traders consider selling their cryptocurrencies.
As can be seen below, in the majority of times, price follows the analysis.
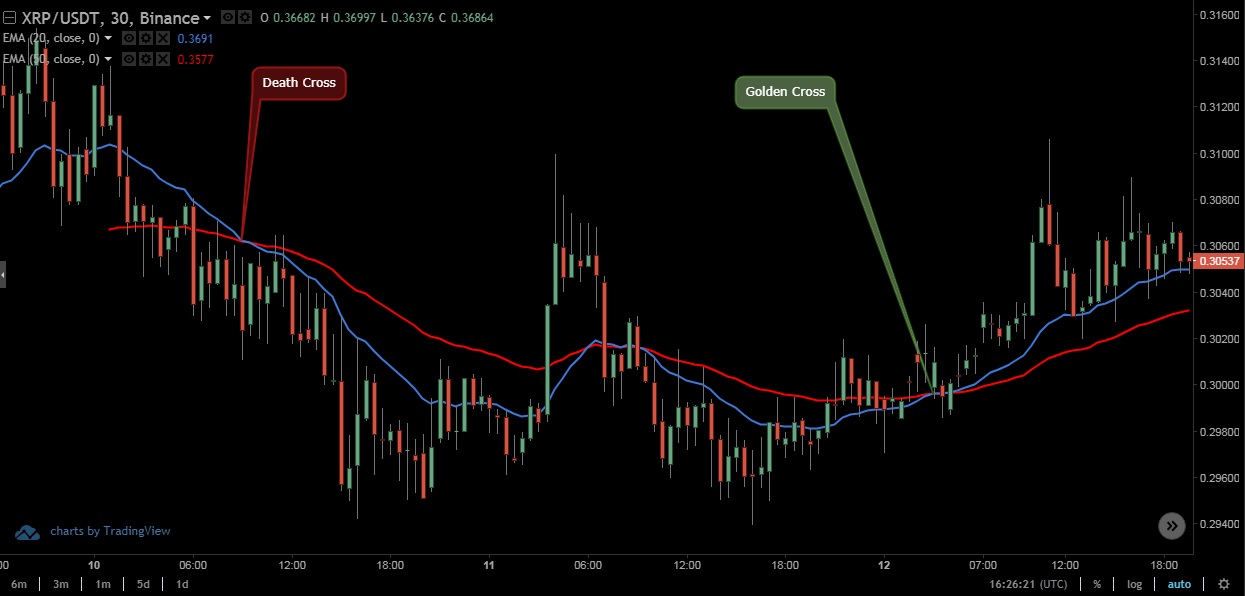
Simple MA may not be enough for day-traders to make an educated decision, therefore, they use the Exponential Moving Average (EMA), which is deduced by a more complicated calculation.
Swing and day-traders, who use shorter timeframes to place trade orders, such as 5-day, 10-day, 20-day, and 50-day, use EMA to take trading positions. Moreover, EMA will be important later on, when explaining one of the most popular technical indicators – MACD.
Relative Strength Index (RSI)
The momentum indicator which tells traders if a cryptocurrency is trading above its currently realistic price (overbought) or below it (oversold) is called the Relative Strength Index (RSI).
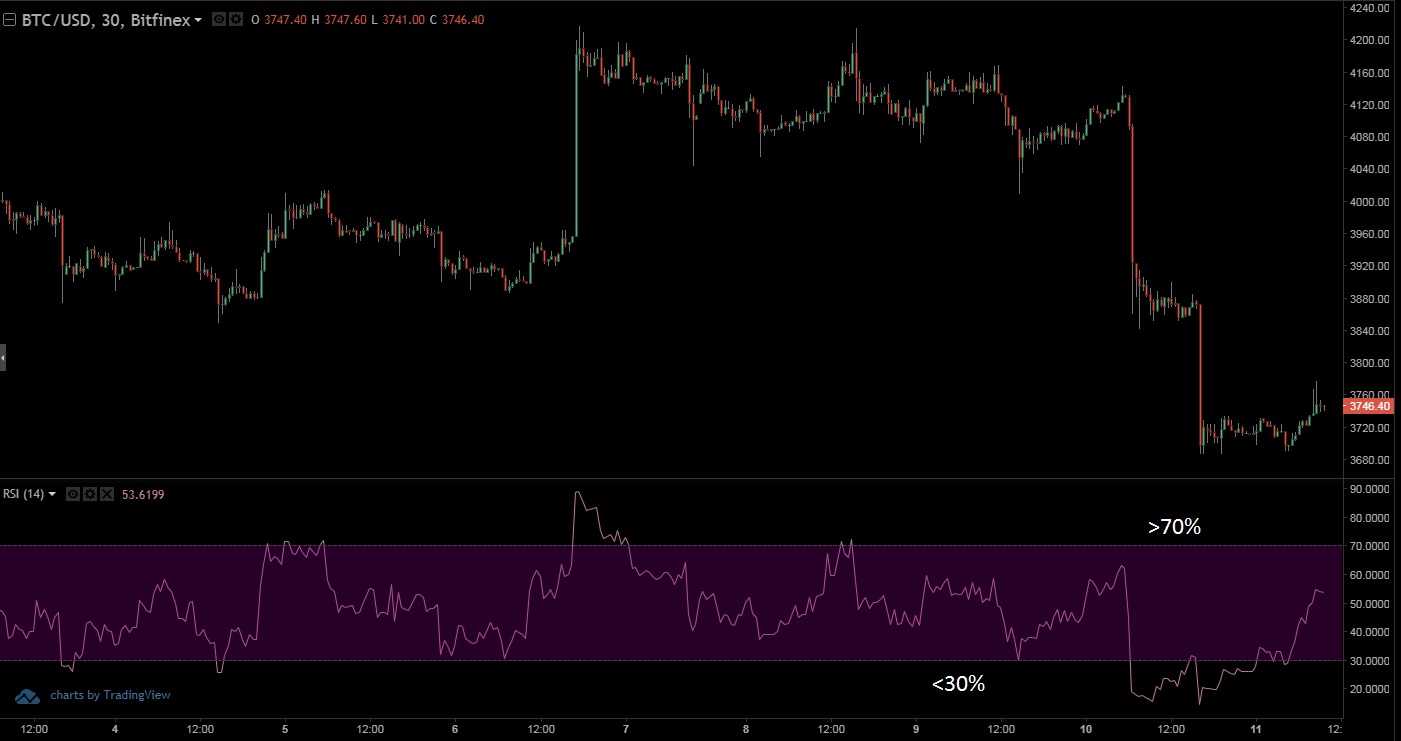
It is represented by the oscillator which travels from 0 to 100, where every value of less than 30 is considered to be overselling, while values above 70 represent overbought cryptocurrency.
When trading in accordance with the RSI, traders use these main methods:
- Pullback trading tactic
- Divergences
- Swing rejections
Pullback trading tactic
Some traders buy a cryptocurrency around oversold values when the trend is up, or place a short trade near an overbought condition in a downtrend.
For example, when the cryptocurrency’s long-term trend is up, traders recognize a buy signal when the RSI falls below the 50-mark, just to immediately return back above it.
This kind of movement represents a price pullback, and the trader takes the position once the pullback, according to the RSI, ends and the long-term trend resumes.
During the implementation of this trading tactic, traders use 50-level as the RSI usually doesn’t reach 30 during an uptrend unless a potential trend reversal has begun.
On the other hand, traders recognize the short-trade signal when cryptocurrency travels in a downtrend and the RSI moves above 50 and then again back below it.
Divergences
Traders can detect bullish or bearish divergence, depending on which trend reversal they mark.
A bullish divergence occurs when RSI value hits higher lows after bottoming out. At the same time, the price of the cryptocurrency hits lower lows, which signal a probable trend reversal.
Traders should wait for the RSI to hit the higher lows and break out before taking the position.
Contrary to its bullish counterpart, a bearish RSI happens when the RSI reading, after reaching a maximum value, hits lower high, which is followed by the price peak.
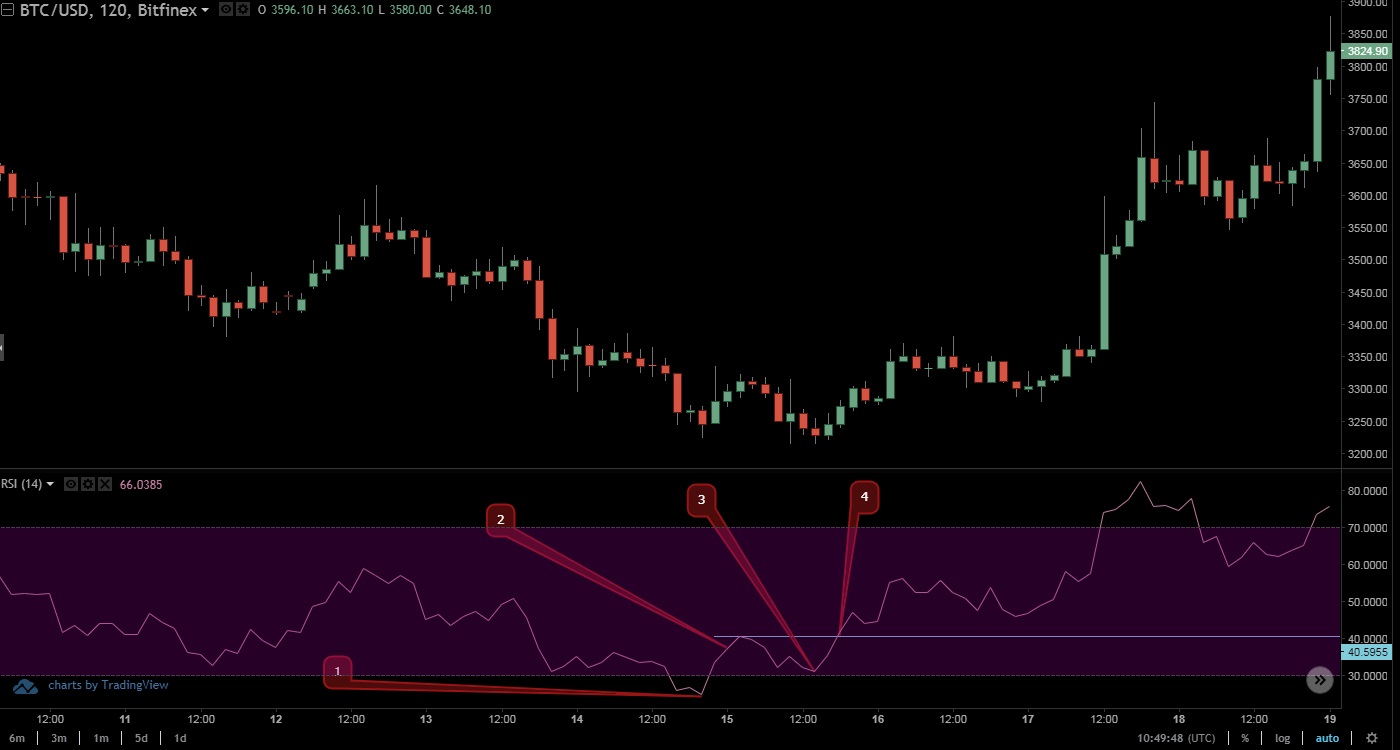
Swing rejections
Swing rejections are slightly more complicated to spot than simple divergences, but the two can as well overlap. Like in the case of Divergences, Swing rejections can be bullish or bearish, according to the trend reversal they tend to announce.
There are four main stages traders should detect to be able to trade in accordance with this bullish reversal trading tactic:
- RSI oscillator drops under the mentioned 30% barrier
- RSI crosses back above 30%
- RSI dips again, this time without crossing back into oversold territory
- RSI then breaks towards the most recent high
Of course, a bearish Swing rejection, contrary to its counterpart, would behave diametrically opposite. A classic example of the bullish Swing rejection can be seen in the BTC / USD chart below.
Stochastic Oscillator
The Stochastic Oscillator is a momentum indicator.
It is comparing the closing price of a cryptocurrency to its price ranges through a certain time frame (usually 14 days). Its sensitivity to market movements is adjustable and can be reduced by prolonging or shortening the time period or by calculating a moving average of the result.
Similarly to the RSI, Stochastic Oscillator reveals if a cryptocurrency is overbought or oversold, but with the main difference that Stochastic Oscillator’s 0 to 100 range movement will remain constant despite the pace by which the price of the cryptocurrency rises or declines. The distinction between the two can best be seen in the BTC/USD chart below.
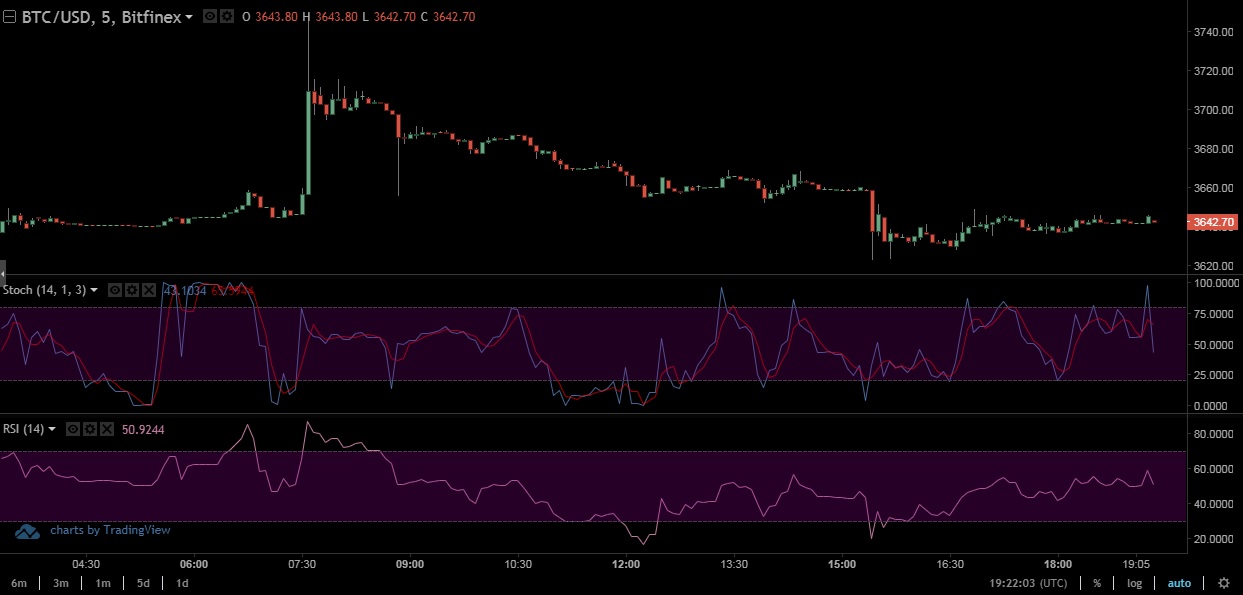
While the RSI signals overbuying and overselling of a cryptocurrency above 70 and under 30, Stochastic Oscillator considers a coin to be overbought when it reaches values above 80 and oversold when it drops below 20.
Stochastics show two lines. The K-line responds faster and the D-line has a slower response time of the two.
Traders need to watch as the D-line and the price of the cryptocurrency begin to change and move into either the overbought or the oversold positions. The sell order is placed when the indicator moves above the 80 levels while doing the opposite (place buy order) when the line drops below the value of 20, accompanied by the rising volume.
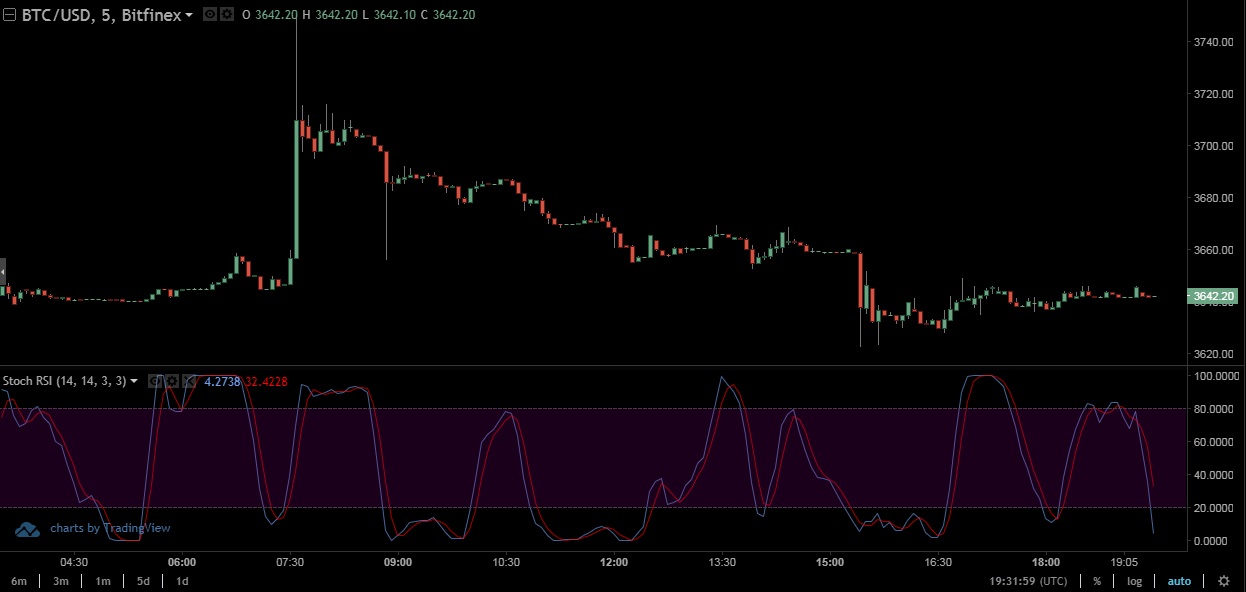
There is also a combination of the two mentioned measurements, called Stochastic RSI, which is calculated by applying the Stochastic Oscillator formula to a set of RSI values instead of standard price data on the scale between 0 and 100, or, in some cases, 0 and 1.
For the comparison purposes, the chart below shows the same chart with the Stochastic RSI indicator.
Moving Average Convergence Divergences (MACD)
As stated before, Moving Average Convergence Divergences (MACD) is second to none among trend and momentum indicators.
Simply put, MACD calculates the difference between cryptocurrency’s 26-day and 12-day Exponential Moving Averages (EMA), with both using closing prices of the measured period.
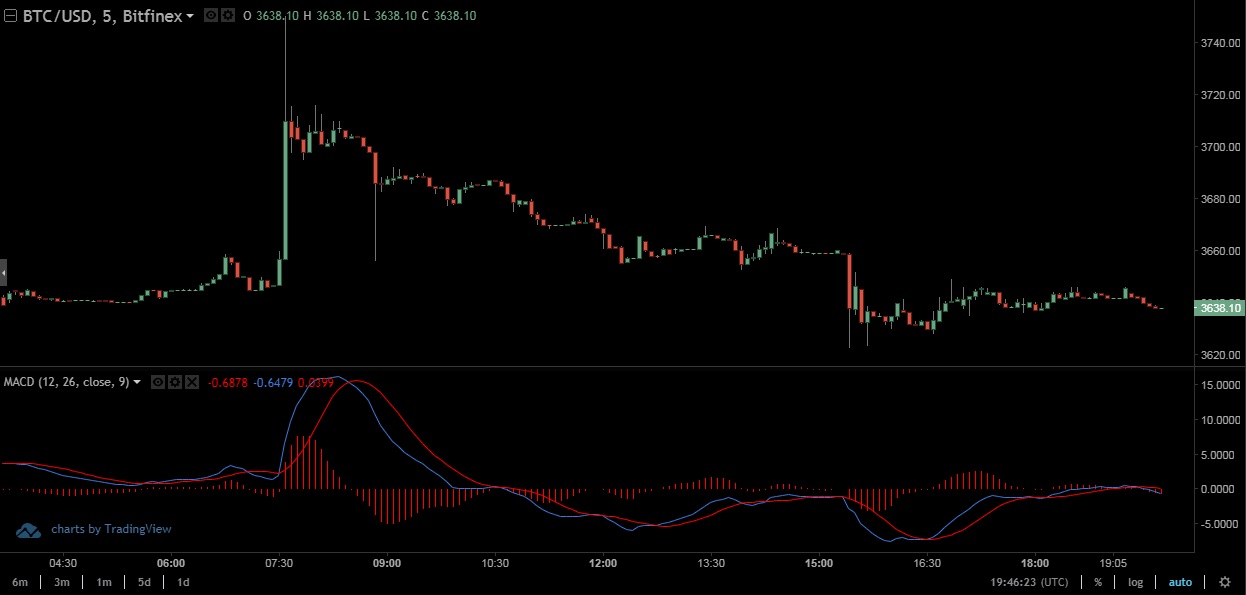
As can be seen in the chart above, a classic MACD chart also features a 9-day EMA, which serves as a signal to place buy and sell orders.
MACD shows a bullish tendency of the price when its reading moves above its own 9-day EMA. On the other hand, traders should consider selling a cryptocurrency when MACD moves below its 9-day EMA.
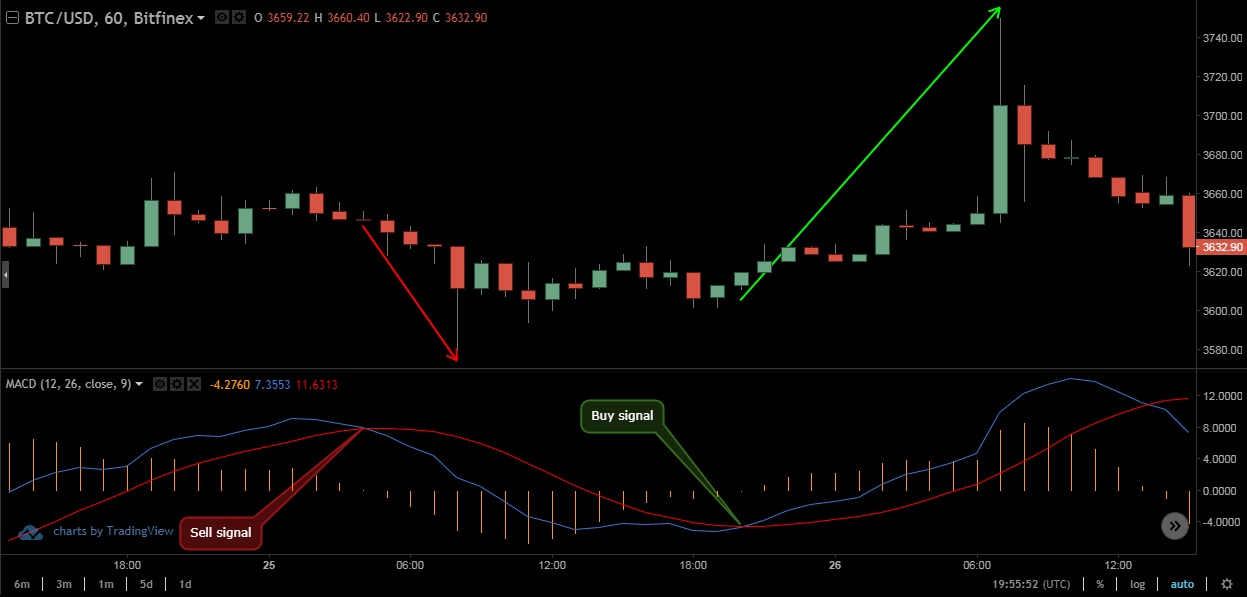
The MACD histogram (orange) is an illustration of the difference between the MACD and its 9-day EMA. The histogram is above its neutral value when the MACD is above its nine-day EMA and below when the MACD is below its 9-day EMA.
The histogram grows larger as the price of the cryptocurrency is growing, and the speed of the price movement is reflected in the histogram’s size. The same applies in those instances when the price of cryptocurrency is declining.
Trading according to divergences
Although MACD can be used as a trend or momentum indicator, traders also tend to use it for trading Divergences.
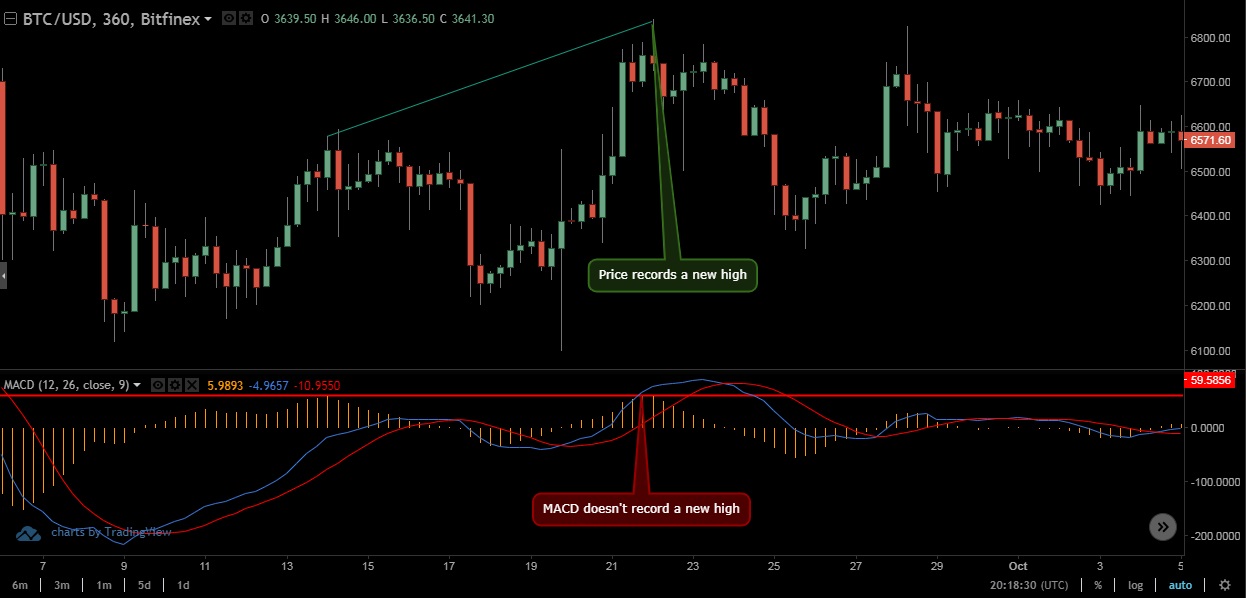
Traders using that tactic wait for the occasion when the price of the cryptocurrency reaches the new high, while MACD fails to do the same, thus revealing a divergence between the price and the momentum, indicating a possible trend reversal.
The BTC/USD chart below shows a classic example of one such divergence.
However, since the cryptocurrency market is highly volatile, trading divergence isn’t by any means a bulletproof way to decide an entry or exit position as the momentum may come in bursts, tricking traders to buy or sell a cryptocurrency prematurely.
Still, traders are able to lower the risk of such divergence fakeout.
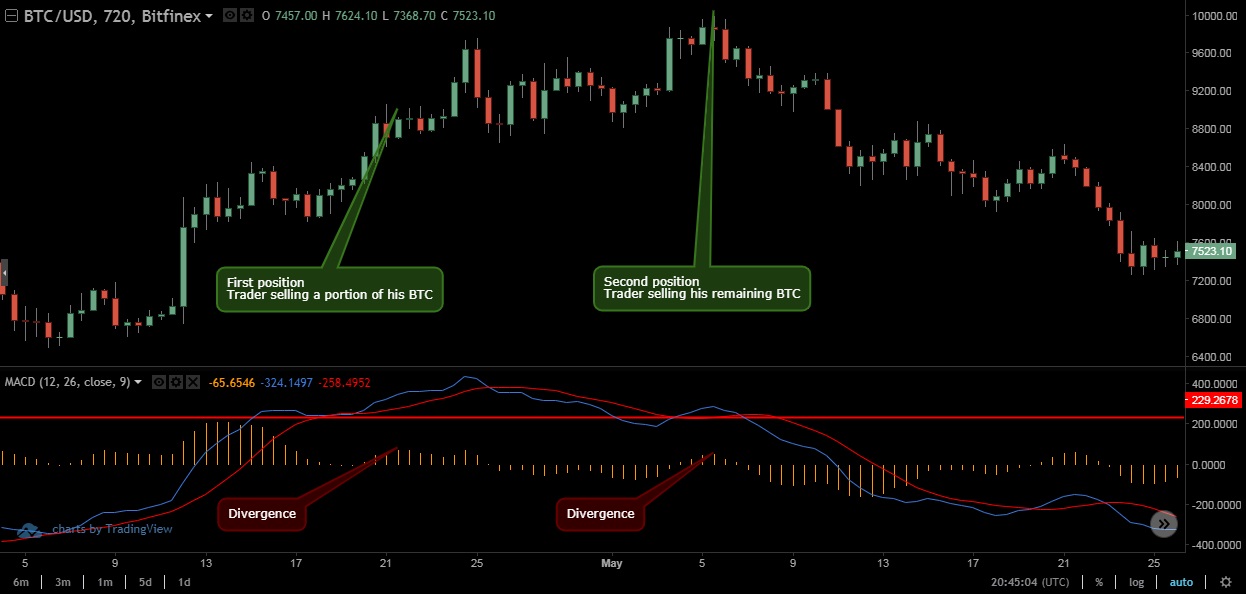
For example, a trader trading a negative divergence takes a partial short position at the initial point of divergence with only a half of his intended investment.
Following the price movement further, instead of placing the stop at the nearest swing high, trader exits the trade only if the high of the MACD histogram exceeds its previous swing high, indicating that he was wrong on the trade.
However, if the MACD histogram does not climb to a new swing high, the trader then adds to his position, thus achieving a higher average price for the short.
The example of divergence trading with partial positions can be seen on the BTC/USD chart below, where a trader would sell a part of the investment when the first divergence occurred, and selling the rest when spotting the second divergence, recording more profits during the trend reversal.
As stated, MACD does not provide everything a trader needs to benefit from the cryptocurrency swing trading, but it can be very helpful if utilized correctly and in accordance with other technical indicators.
Average Directional Indexes (ADX)
The Average Directional Index (ADX) is a technical indicator used to determine the relative strength of a cryptocurrency’s price moving trend, and how likely it is for the asset to sustain it.
The ADX readings of over 25 reveal a strong growth trend, and a weak trend is represented by the readings below 20.
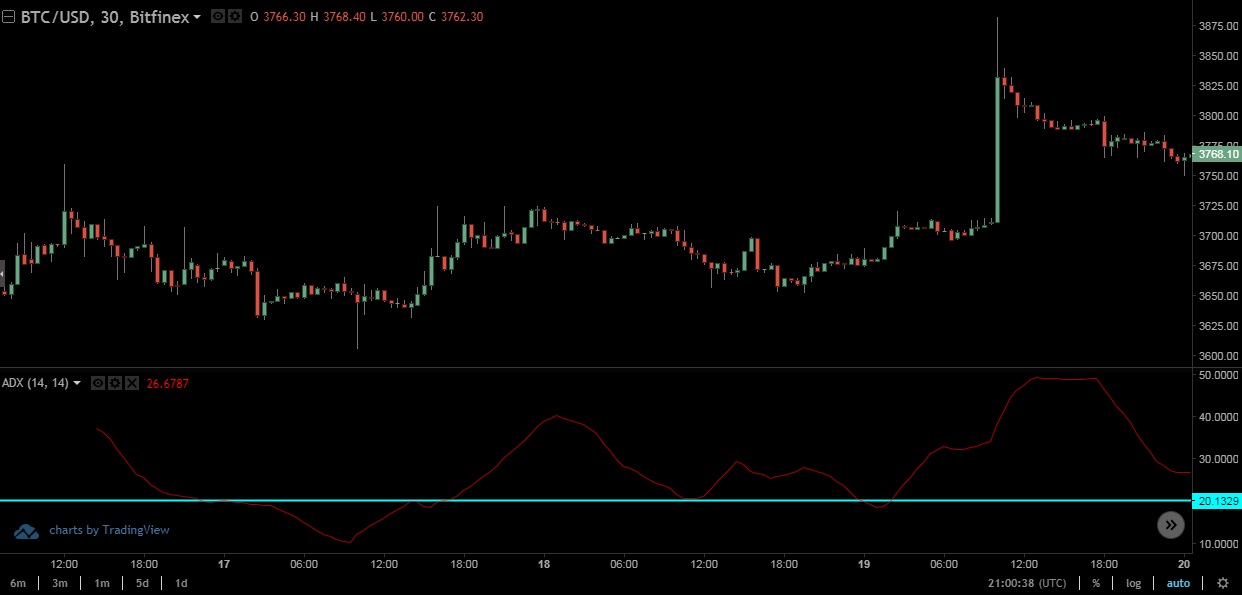
Traders usually do not take positions exclusively in accordance with the ADX, but use it to supplement the possible lack of other indicators, or additional directional information and support.
On-Balance Volume (OBV)
The definition states: “On-balance volume (OBV) is a momentum indicator that uses volume flow to predict changes in the price of the cryptocurrency.” It follows the premise that when volume increases sharply, but it fails to produce an impact on the price, the valuation of the cryptocurrency will eventually follow the volume and vice versa.
On the back end, however, OBV is used to differentiate investments made from large investors (institutional investors or popular whales), and retail investors.
For example, when whales start buying a cryptocurrency from the retail sellers, the volume of the crypto asset would rise while the price of the coin could easily remain fairly level. Institutional investors, due to the rising volume, lure in retail investors and the price is pushed upward.
Eventually, whales start selling once they are satisfied with gains, while retail investors keep buying, which is reflected on the volume and, analogically, on the OBV.
Divergence
Like it is the case with other indicators, the main tactic for trading in accordance with OBV is spotting divergences between the indicator readings and price movement, which might announce trend reversals.
The main postulate of OBV divergence is that the volume precedes the price movement.
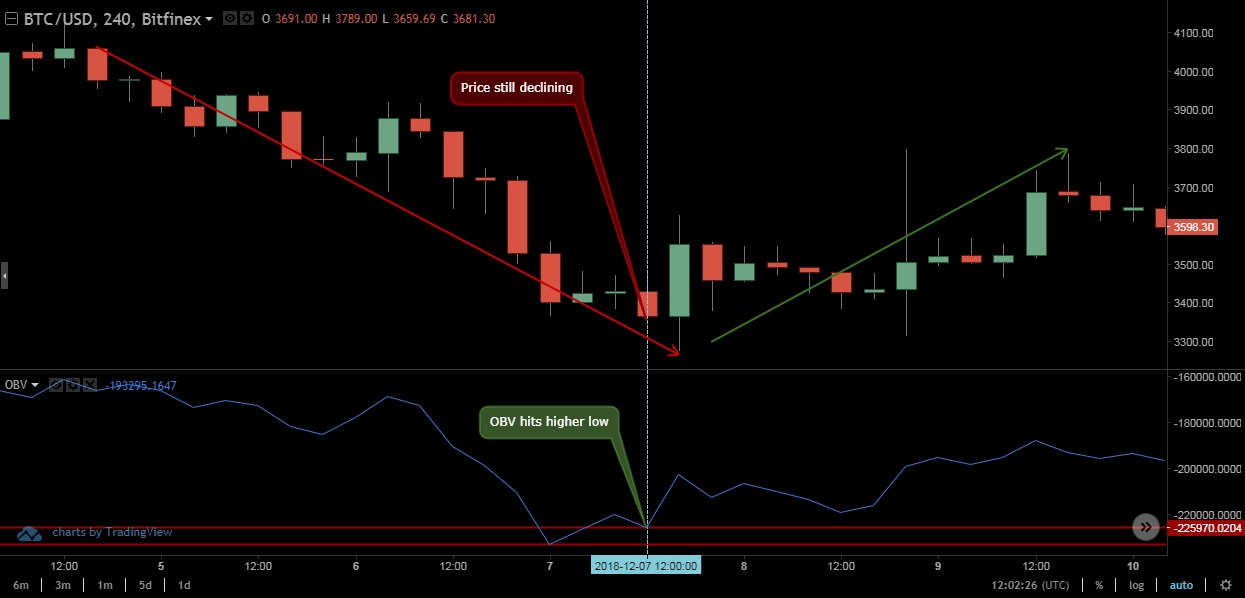
Therefore, the bullish divergence happens when the OBV forms a higher low despite the fact that the price is still moving downward. Of course, its bearish counterpart can be spotted by the lower highs of the indicator, while the price still climbs.
One eclatant example of the bullish OBV divergence can be seen in the chart below.
The OBV technical indicator can help a trader to deduce the future movement of the cryptocurrency’s price through the correlation between the price and the volume. In combination with other indicators covered in this guide, it can provide valuable market insight.
The conclusion
Each of these indicators is widely used by traders individually as well as in combination with other technical or fundamental analysis segments, depending on the market conditions and asset in question.
Although every instrument is more than useful when making trade decisions, learning new trading tactics based on the firm technical foundations and implementing them into the trading strategy can only lead to a higher success rate, and thus, bigger gains.
In the end, we hope that this guide provided valuable information which will help you enhance your trading technique. Stay tuned for more similar content here at the Coinalyze blog.
Until the next time, trade responsibly.
Disclaimer: This article is not investment advice. Note that cryptocurrencies are highly volatile assets and very risky investments. Do your research or consult an investment professional before investing. Never invest more than you can afford to lose. Never borrow money to invest in cryptocurrencies.