All Fibonacci trading tools are based on the simple calculation made by the Italian Mathematician Leonardo Pisano, a.k.a. Fibonacci back in the 13th century.
The Fibonacci number sequence is based on the postulate that every number is after 0 and 1 equals the sum of the two previous numbers. So the sequence looks like this: 0, 1, 1, 2, 3, 5, 8, 13, and so on.
The calculation, although a simple one, is applicable not only to cryptocurrency (and other) trading but also on many forms of the natural world, architecture, biology, fine art, and even distant galaxies.
The fact that, according to the Fibonacci calculation, every number is 1.618 greater than the number before it, gives us the so-called golden ratio. The inverse of the golden ratio is 0.618, and that brings us to the basic percentage of Fibonacci trading tools, which is 61.8%.
Using the Fibonacci numerical order, we can derive other basic percentages of all Fibonacci trading tools, and those are 23.6%, 38.2%, and the mentioned 61.8%.
There are more Fibonacci tools used in trading, but in this article, we are going to explain how to use five of them:
- Fibonacci retracement
- Fibonacci time zones
- Fibonacci speed resistance fan
- Fibonacci speed resistance arks
- Fibonacci channel
Fibonacci retracement
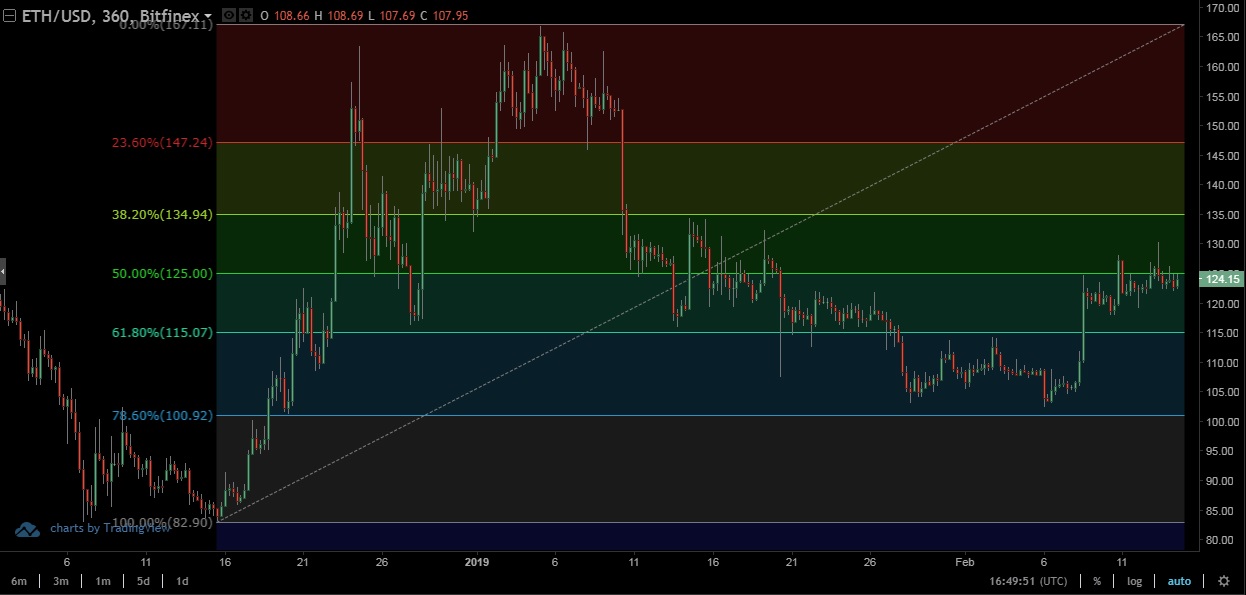
As you can see in the ETH / USD price chart above, Fibonacci retracement is what we get between the most recent lowest and highest price. However, some of our readers will spot that not all percentages in the retracement are in accordance with the Fibonacci calculation. There is also 50%, which was added as another important barrier in the fluctuation of price between the two extreme values.
Looking at the Fibonacci retracement, traders look to deduce the possible trend reversals as the main horizontal lines can be the exact points from where the price of the cryptocurrency can bounce in the other direction.
So, let’s see if it really works that way.
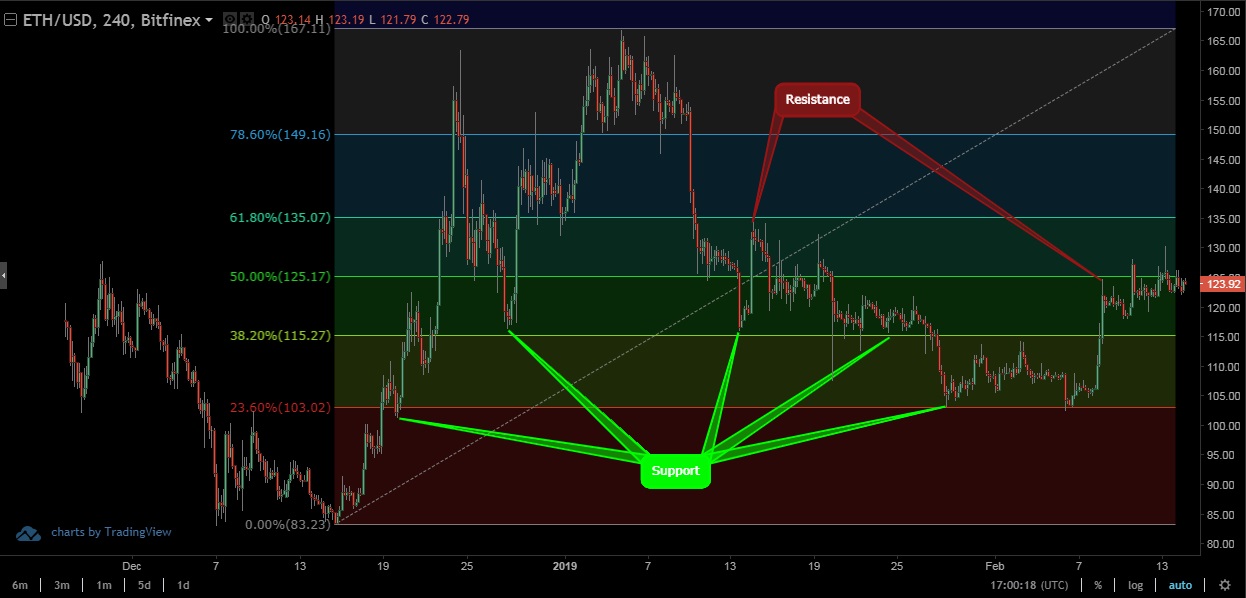
In the same ETH/USD chart, we have connected the recent price low of $83 and a high of $167 to get the fundamental percentages on our Fibonacci retracement.
It immediately becomes obvious that the price of Ethereum on more than a few instances really does bounce between the basic Fibonacci lines. Although it doesn’t have to be at the exact level, the Fibonacci lines of 23.6%, 38.2%, 50%, and 61.8% can always be viewed as approximate reversal points.
Indeed, ETH uses the 23.6% line as a support level on three occasions, while doing the same with the 38.2% also on three occasions. The 61.8% line acted as a support and resistance, and our top 5 cryptocurrency in the market used the 50% line as resistance on one occasion.
Therefore, the simple Fibonacci retracement clearly shows that there surely is something almost magical with that number sequence and that it is more than applicable on the human psyche.
Fibonacci time zones
The same principle as on the retracement is used on the Fibonacci time zones, only vertically.
Numbers 0, 1, 2, 3, 5, 8, etc. are used to draw the so-called vertical timelines, which can show the possible points when some changes are going to happen in the market.
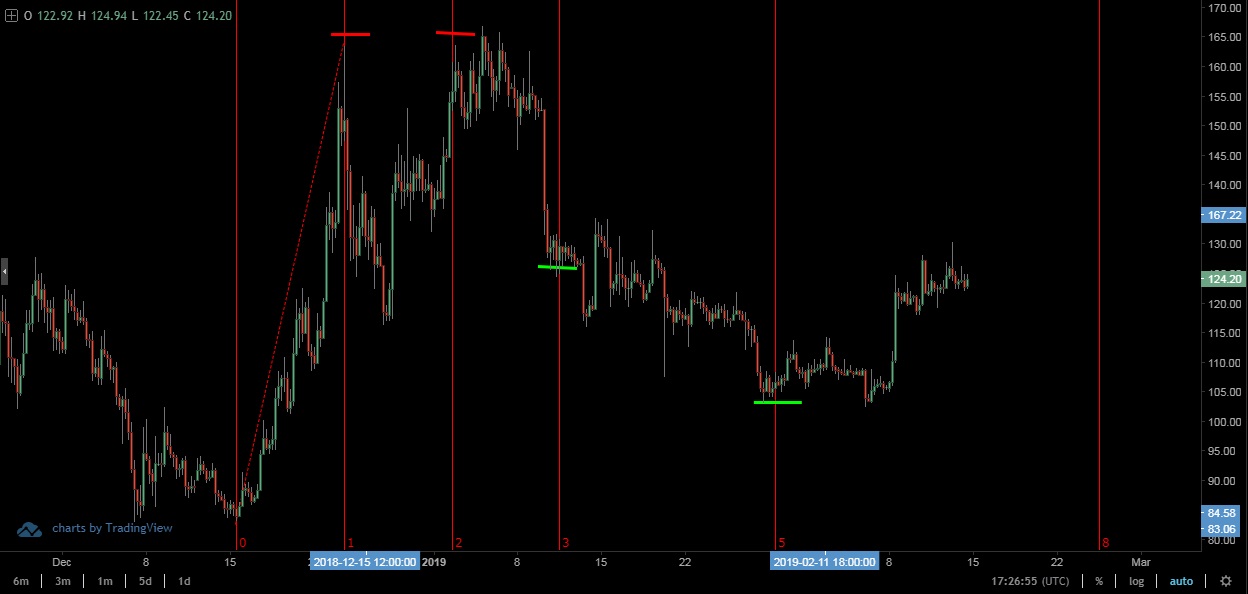
In order to show you that it really is like that, we have swapped the classic retracement shown previously with the Fibonacci time zone tool. Immediately it is clear that every line marks some significant occurrence in the Ethereum’s price movement.
Be it the new resistance or support, it somehow gets established around those 1, 2, 3, and 5 line.
Interesting, isn’t it?
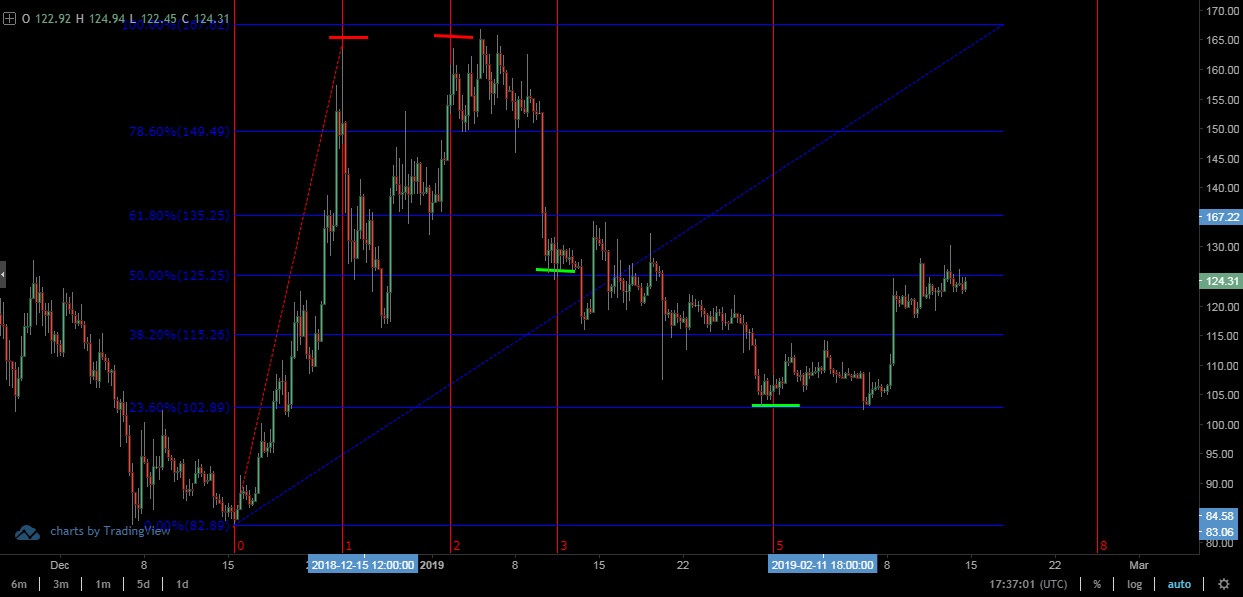
The Fibonacci time zone tool can be combined with the Fibonacci retracement to give traders deeper insight like in the chart below, which again reveals that the golden ratio is applicable to cryptocurrency trading.
Fibonacci speed resistance fan
Fibonacci speed resistance fan also uses the golden ratio to reveal the possible important changes in the market movement.
The line is also drawn between the lowest and highest price point, and the 0.25, 0.382, 0.5, 0.618 and 0.75 lines are automatically set on both sides of that base.
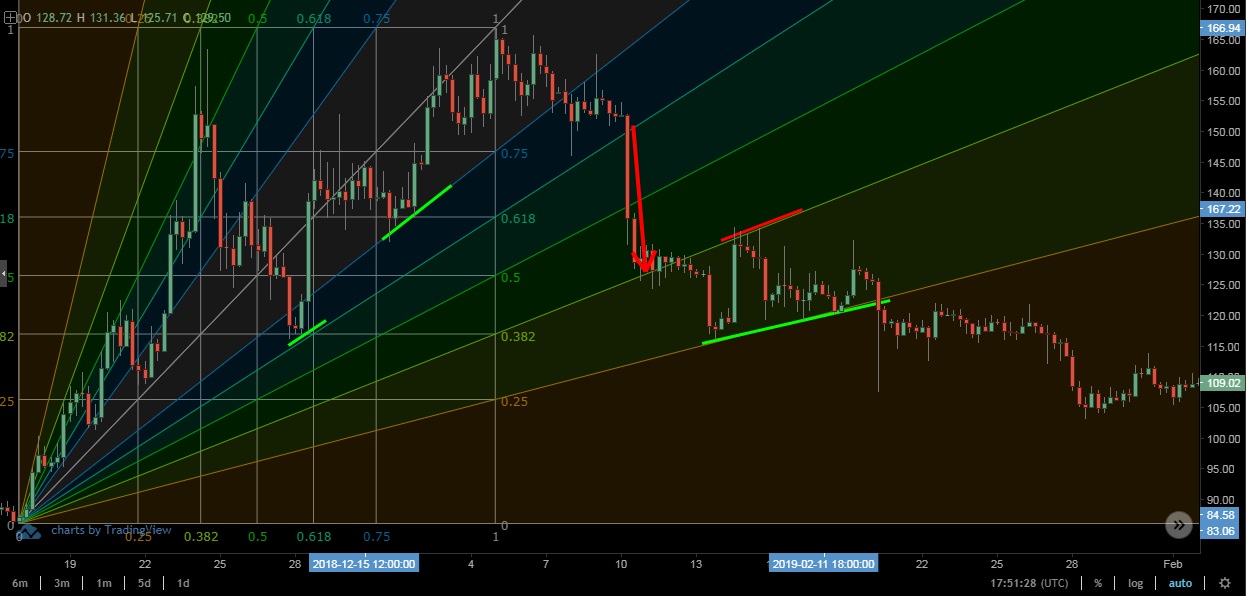
Again, as can be seen in the ETH/USD chart above, the Fibonacci speed resistance fan does a good job revealing the changing market conditions, acting as a support and as a resistance more than a few times.
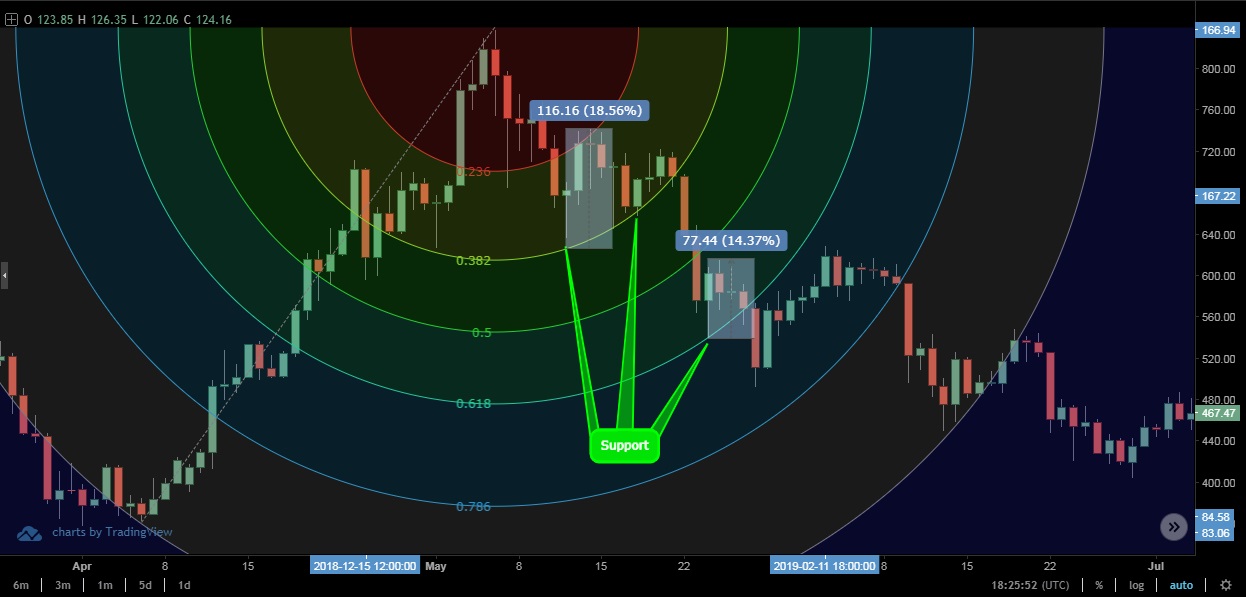
Fibonacci speed resistance arcs
Similarly to speed resistance fan, the Fibonacci speed resistance arks can, when drawn correctly, predict approximate points of some important market occurrences.
Same as with all other Fibonacci tools, the highest and the lowest recent price points are connected with the line, and from the second point the arcs are drawn in accordance with the golden ratio standard.
The ETH/USD chart below shows how the Fibonacci speed resistance fan could have helped traders spot at least three resistance point in the bearish movement of the cryptocurrency. Day traders who utilized this Fibonacci tool in their trading tactic could have scored a hefty day profit of 14% or even 18% on two occasions.
Fibonacci channel
The Fibonacci channel tool is the most dependable on the skill of the trader to spot the highs and lows and connect the right ones in order to profit from the reading the chart.
The A, B, and C reference points of the channel, once connected with the lines will produce the channel according to the golden ratio which will be able to reveal support and resistance points in accordance with the horizontal movement of the cryptocurrency’s price.
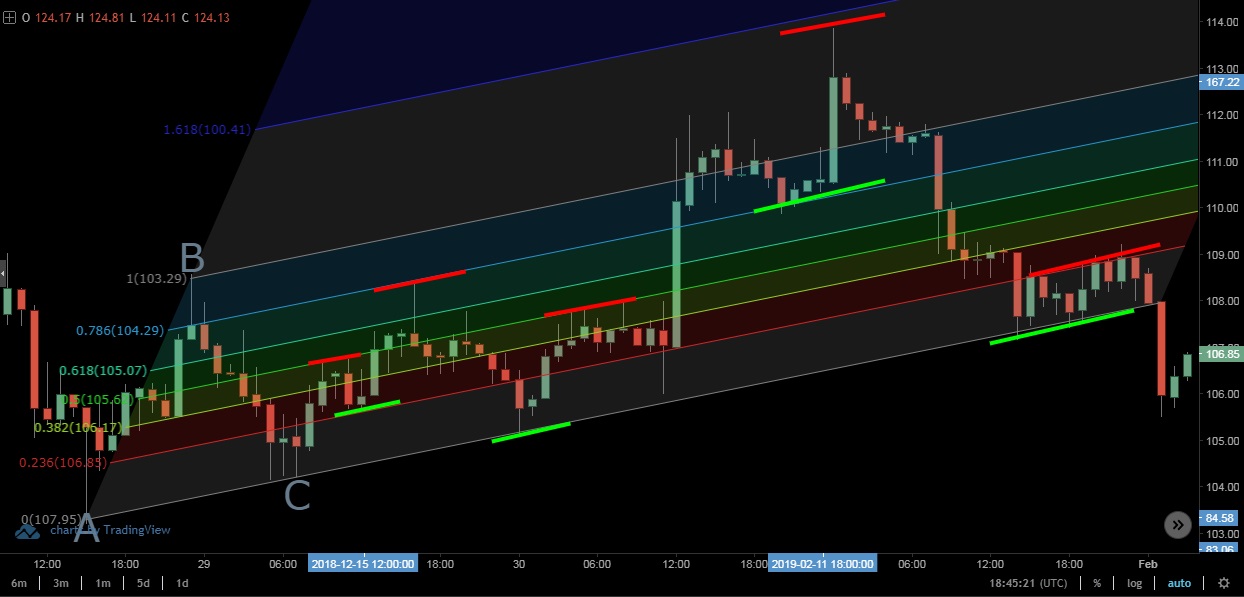
As it is clearly shown in the ETH/USD chart above, when properly done, the Fibonacci channel can provide a spot-on trader’s assistance.
Our channel clearly deduced two supports at line 0, one at 0.236, and one at 0.786, while at the same time showing resistances at 0.236, 0.5, 0.786, and finally, once the Ethereum’s price breached the barrier of 1, the next resistance proved to be just under 1.618.
Combining Fibonacci tools with other technical indicators
Of course, it is much easier to draw a Fibonacci after the market cycle in question has passed than at the beginning of the spotted cycle and trade in accordance with the reading.
However magical the golden ratio that Fibonacci tools are based on may seem, the market sometimes takes unexpected turns, especially the one so volatile as the cryptocurrency market.
Therefore, experienced traders tend to combine Fibonacci tools with other technical indicators, such as MACD or Stochastics oscillator.
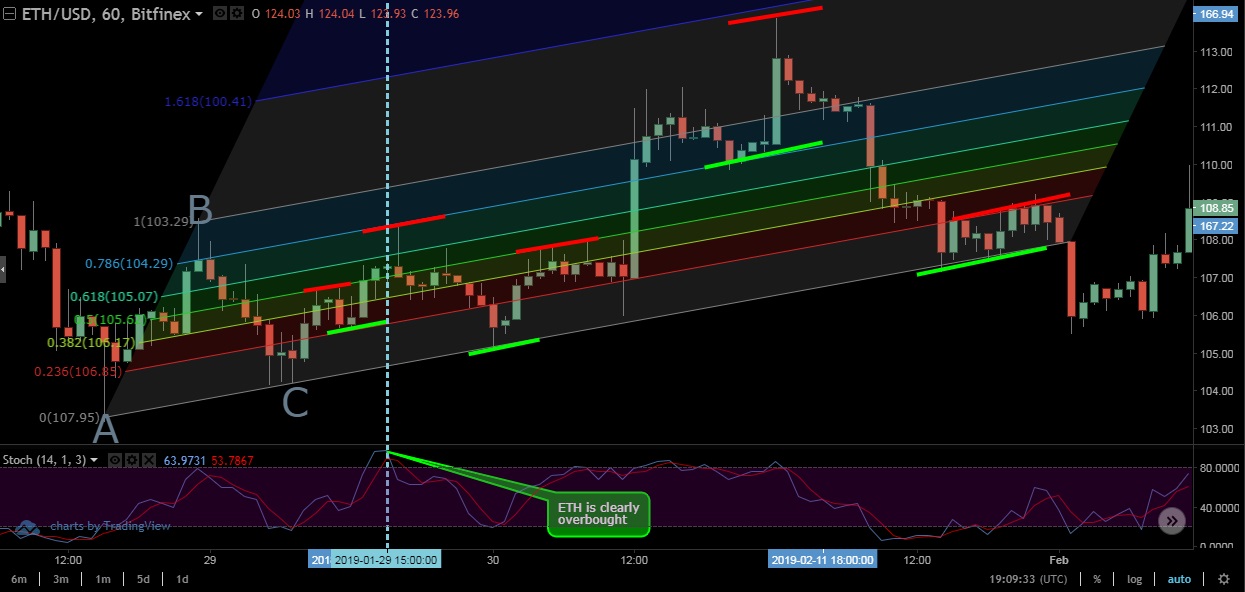
The ETH/USD chart above shows that just before reaching the 0.786 line on the Fibonacci channel tool, the Stochastics oscillator shows that ETH has clearly been overbought. That means that, probably, the 0.786 line will act as a resistance for the time being, until a new buying wave happens.
Otherwise, other technical indicators can serve as the trend confirmation tools along with Fibonacci.
The important thing is that both tools are applied properly.
Conclusion
Mathematics is the basis for science, and that is the reason why the golden ratio is applicable to so many parts of the universe.
Fibonacci tools only provide a way to measure human behavior, and that is why they are so usable in cryptocurrency trading.
Broadening your specter of knowledge with new trading tactics can only lead to more ways of deducing what the majority of traders in the market will do next.
Therefore, we hope that this article provided a useful resource for you to enhance your trading skills, and thus, your profits.
Until the next time, trade responsibly.
Disclaimer: This article is not investment advice. Note that cryptocurrencies are highly volatile assets and very risky investments. Do your research or consult an investment professional before investing. Never invest more than you can afford to lose. Never borrow money to invest in cryptocurrencies.