Bollinger Bands are a combination of the 20-day Exponential Moving Average (EMA) and two bands forming channels, representing the price volatility.
The Bollinger Bands’ channels are calculated by simply adding and subtracting a standard deviation calculation – a mathematical formula that measures how much the price of a cryptocurrency can vary from its true value.
In shorter terms, Bollinger Bands are used by traders to recognize trading activities around the ongoing trend.
Using Bollinger Bands
These trading activities can reveal traders sentiment towards a crypto asset and price trend reversals.
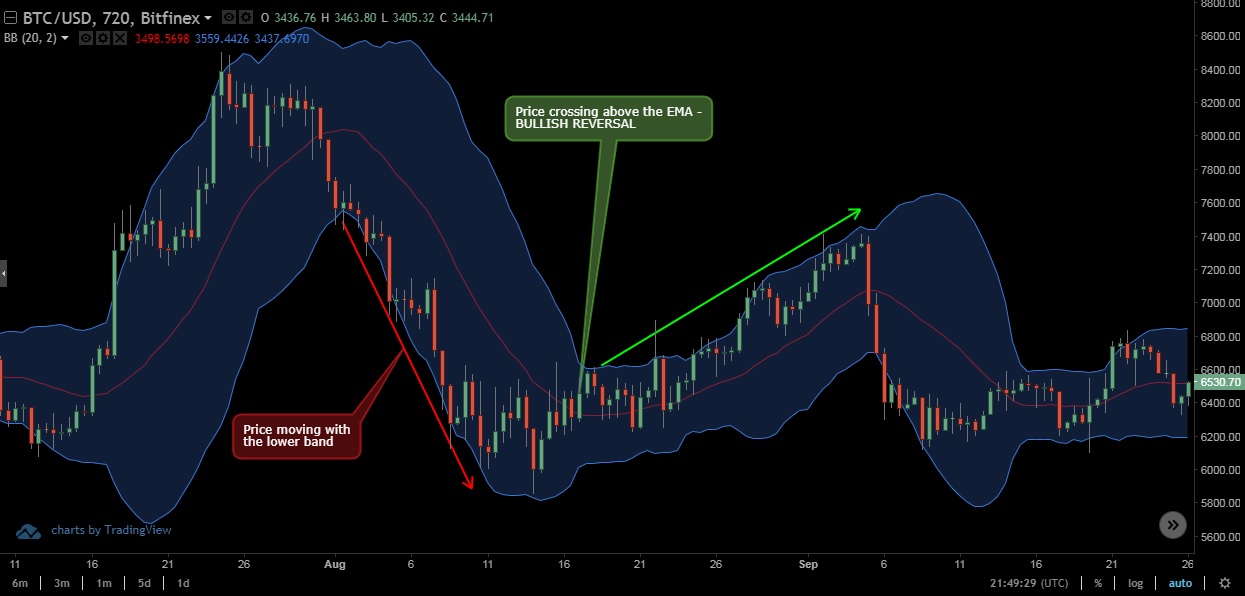
When the price of the cryptocurrency is touching the lower band, a digital asset is considered to be oversold, contrary to the pattern when the price reaches the upper band, a cryptocurrency is being overbought.
In some instances (the BTC / USD price chart below), traders can spot that the price of the cryptocurrency is traveling under the EMA for a period of time, occasionally touching the lower band of the Bollinger Band oscillator. Once the price movement passes across the EMA to the upper side of the Bollinger Band oscillator, that can be considered as a bullish trend reversal, indicating a good long position.
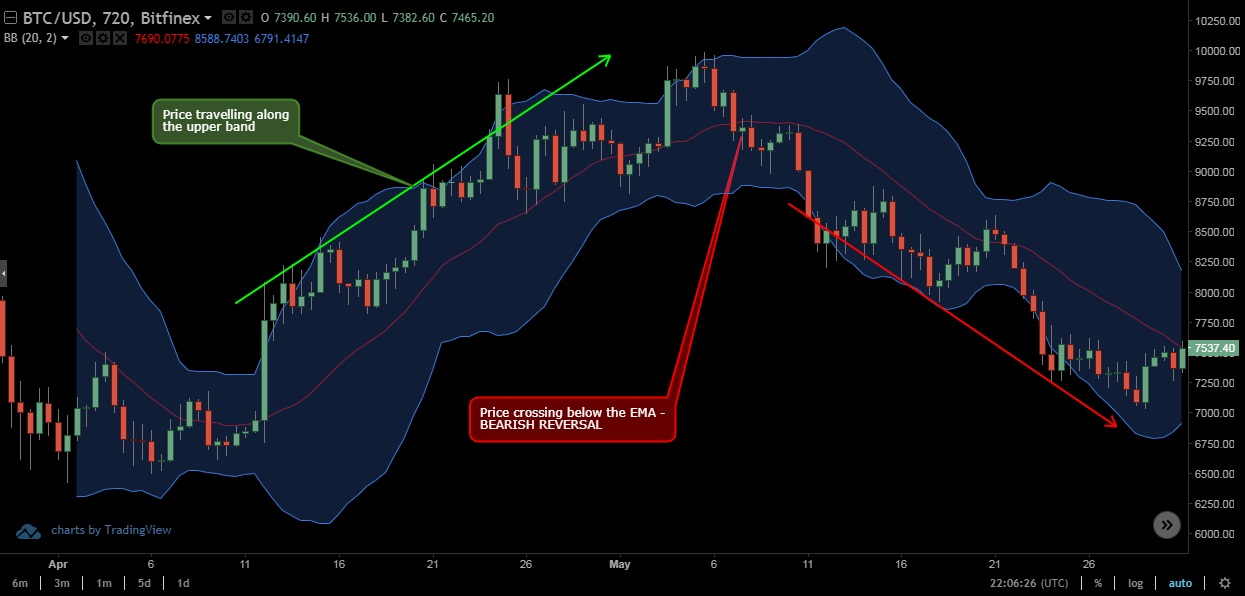
Opposite to the bullish reversal, Bollinger Bands can also reveal its bearish counterpart.
When the price of the cryptocurrency crosses below the EMA oscillator after traveling above it for a longer period of time, like in the BTC/USD chart below, it signals a bearish trend reversal.
Recognizing price targets
Day and swing traders also use Bollinger Bands to determine price targets.
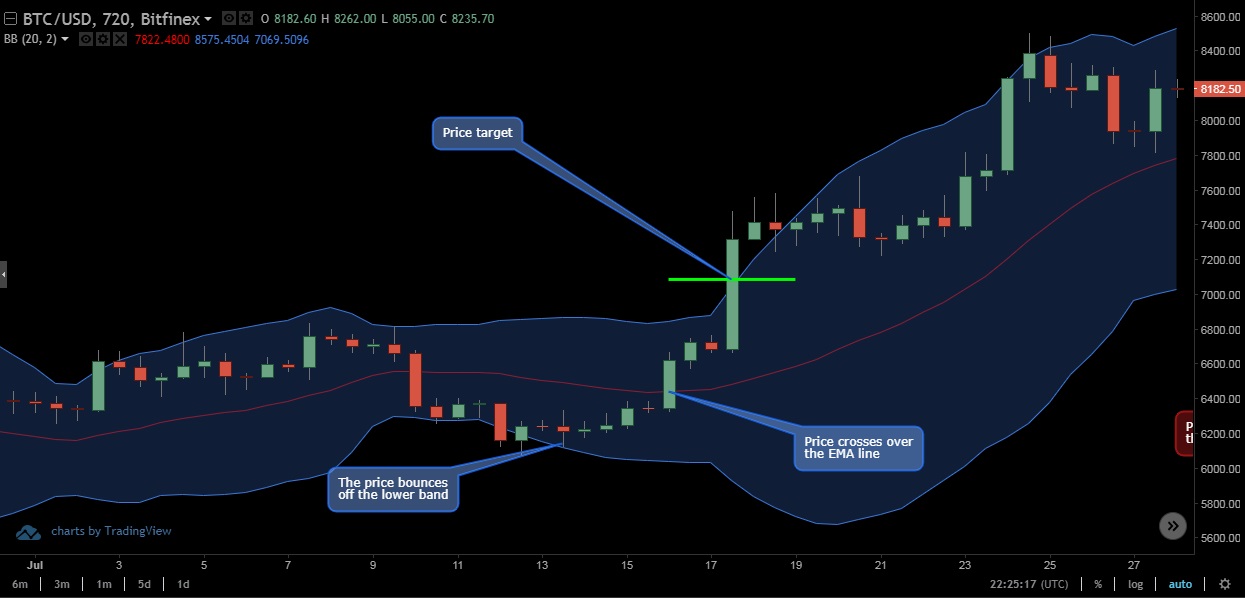
During the bullish reversal, when the price bounces off the lower band and crosses over the 20-day EMA line, swing traders take the first instance when the price hits the upper band as a price target.
The BTC/USD chart below shows the classic example of swing traders’ short-term position and price target in accordance with the Bollinger Bands technical indicator. Of course, the same can be decided for bearish movement, when traders decide when to enter the trade.
Divergences
Like it is the case with the majority of technical indicators, Bollinger Bands can be utilized to reveal divergences, which tend to also announce trend reversals.
The easiest way to do that is to combine the Bollinger Bands and Bollinger %b indicators.
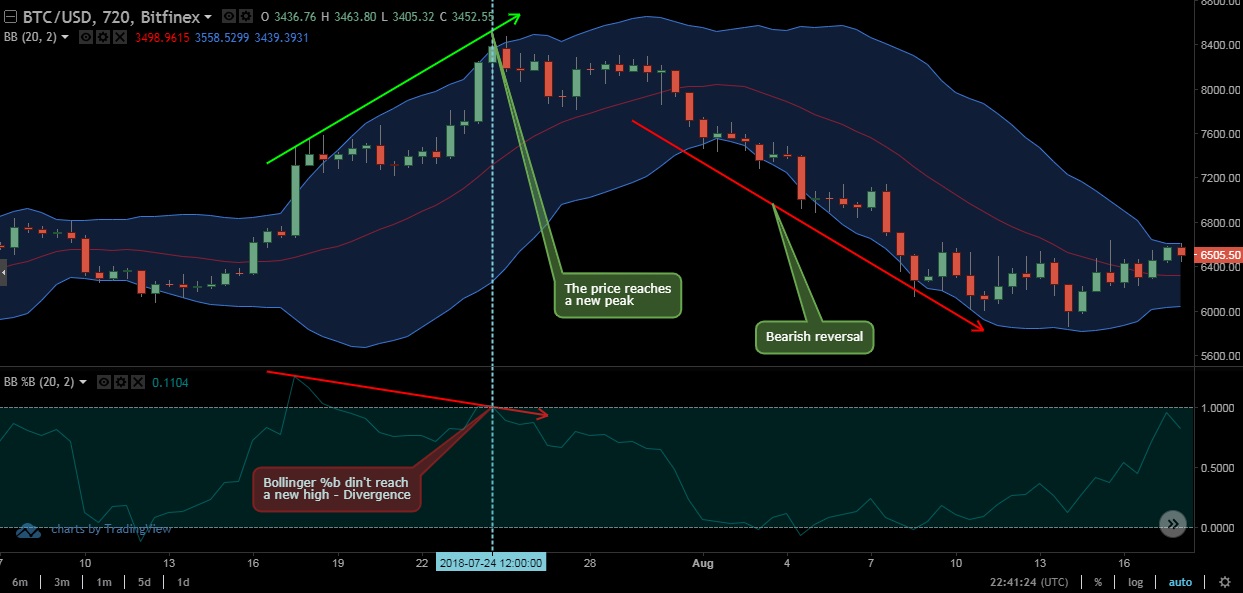
As it can clearly be seen in the BTC/USD chart above, while the Bitcoin price started its bullish trend with a strong overbuying session, reaching the first peak in the process, the overbuying trend didn’t continue.
Therefore, despite the fact that the price reached a new, higher peak, Bollinger %b had a lower high, representing a change of traders sentiment towards the number one cryptocurrency. Naturally, that resulted in a bearish reversal.
The same principle is applicable to the opposite occurrence.
Combining Bollinger Bands with other indicators
Although Bollinger Bands is among the most used technical indicators, it is still considered to be a bit exotic, so it is recommendable to use it in combination with other, more basic technical indicators.
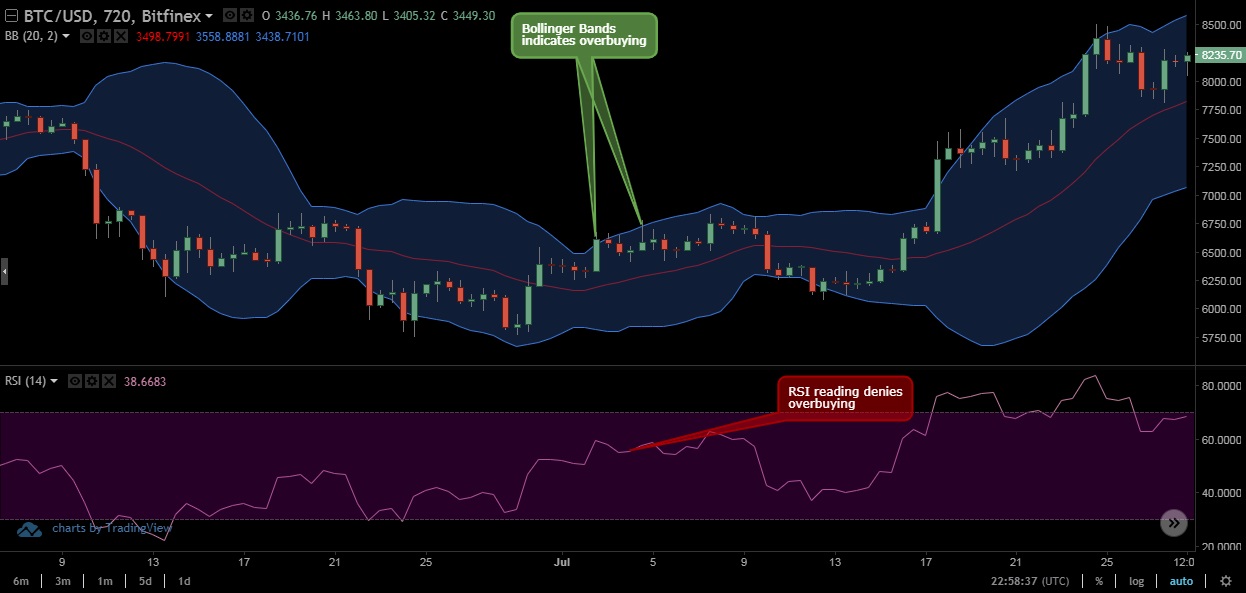
To be sure that a cryptocurrency is overbought or oversold it is best to complement Bollinger Bands readings with the Relative Strenght Indicator (RSI), as for example, the price can cross the upper band and falsely indicate the overbuying of a cryptocurrency.
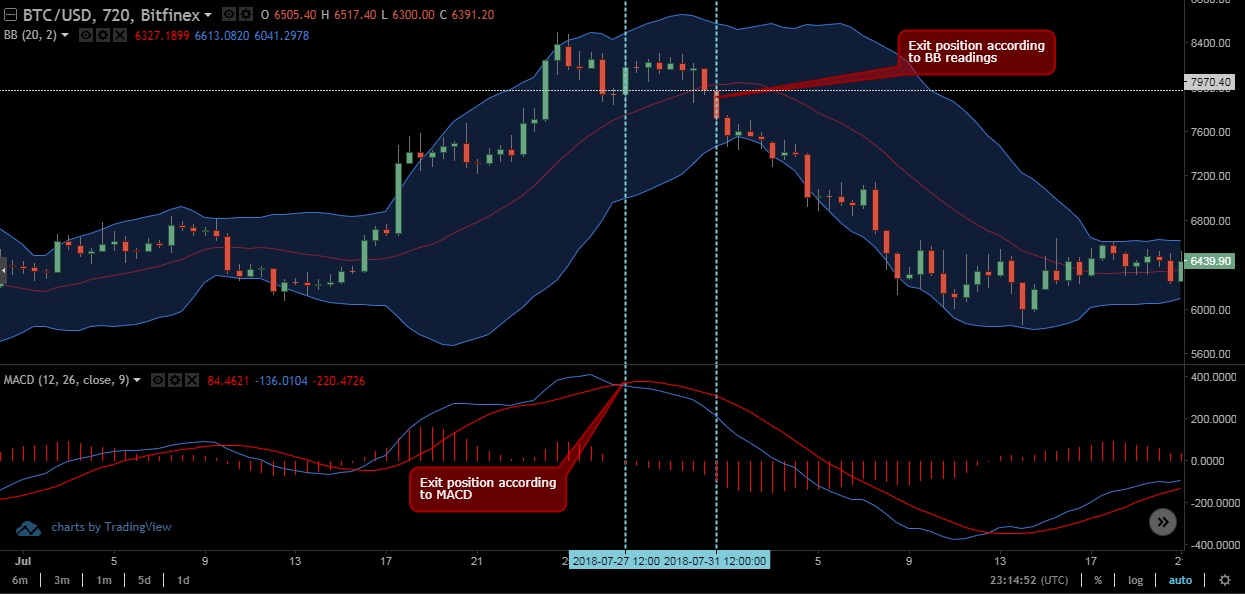
Experienced traders also tend to combine Bollinger Bands with MACD indicator, which, besides revealing if the cryptocurrency is overbought or oversold, shows possible trend reversals.
The following chart shows how combining MACD and Bollinger Bands can confirm the trend reversal, with MACD preceding the Bollinger Bands reading in this instance. By complementing one with the other, traders don’t have to wait for the price to cross all the way below 20-day EMA to confirm the reversal, saving a percentage of their profit.
Bollinger Bands is, as proven, a very polyvalent technical indicator, which shows its full potential in combination with other readings. However, to truly enhance trading profits, aspiring traders should learn as much as possible about various trading techniques.
We hope that this guide provided valuable information which will help you improve your trading method. Stay tuned for more similar content here at the Coinalyze blog.
Until the next time, trade responsibly.
Disclaimer: This article is not investment advice. Note that cryptocurrencies are highly volatile assets and very risky investments. Do your research or consult an investment professional before investing. Never invest more than you can afford to lose. Never borrow money to invest in cryptocurrencies.