If you are using Coinalyze you may have run into some fresh additions in the technical indicators department. We have implemented Buy vs Sell Volume and Buy vs Sell Count indicators. Visually, these two indicators look similar to the regular volume bars. However, there is a significant difference.
In order to explain thoroughly what each of these useful tools does, we are going to dissect them separately.
Buy vs sell volume
Buy vs sell volume represents the exact ratio between the amount of bought and sold coins inside the predetermined timeframe. The indicator is practically visualized by green bars going up for buy volume and red bars growing downwards for sell volume.
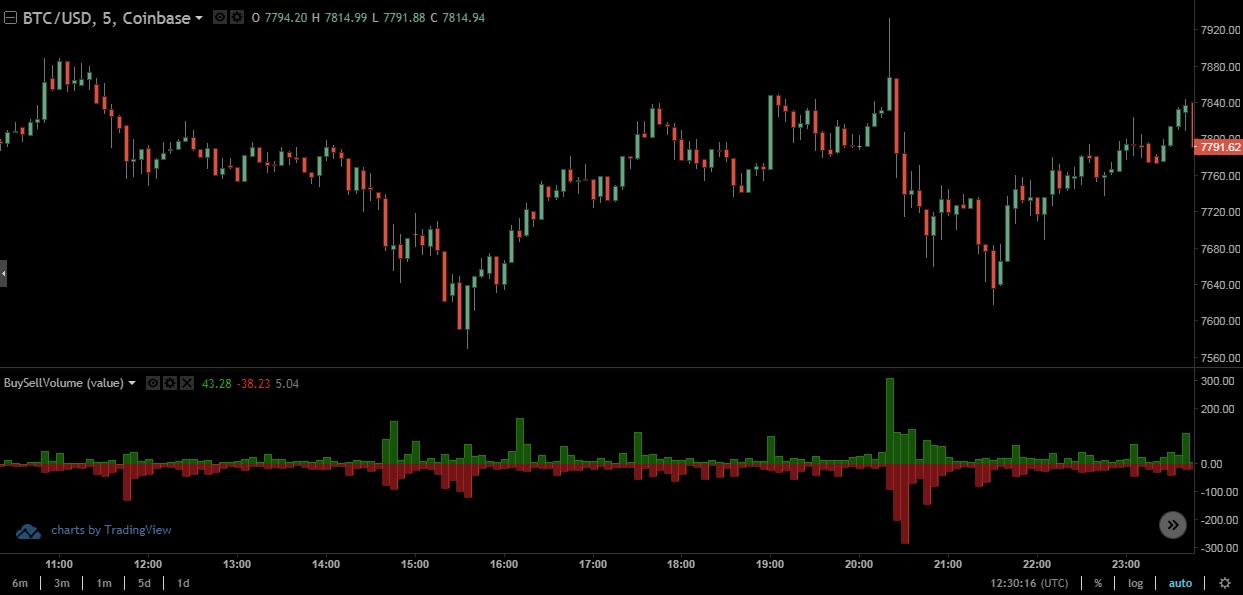
Contrary to the traditional volume indicator, buy vs sell volume provides a clear insight into the most important thing volume can reveal – how much demand really exists for a cryptocurrency. This indicator can be very useful in revealing the upcoming market trends, so let’s explain this through a series of examples.
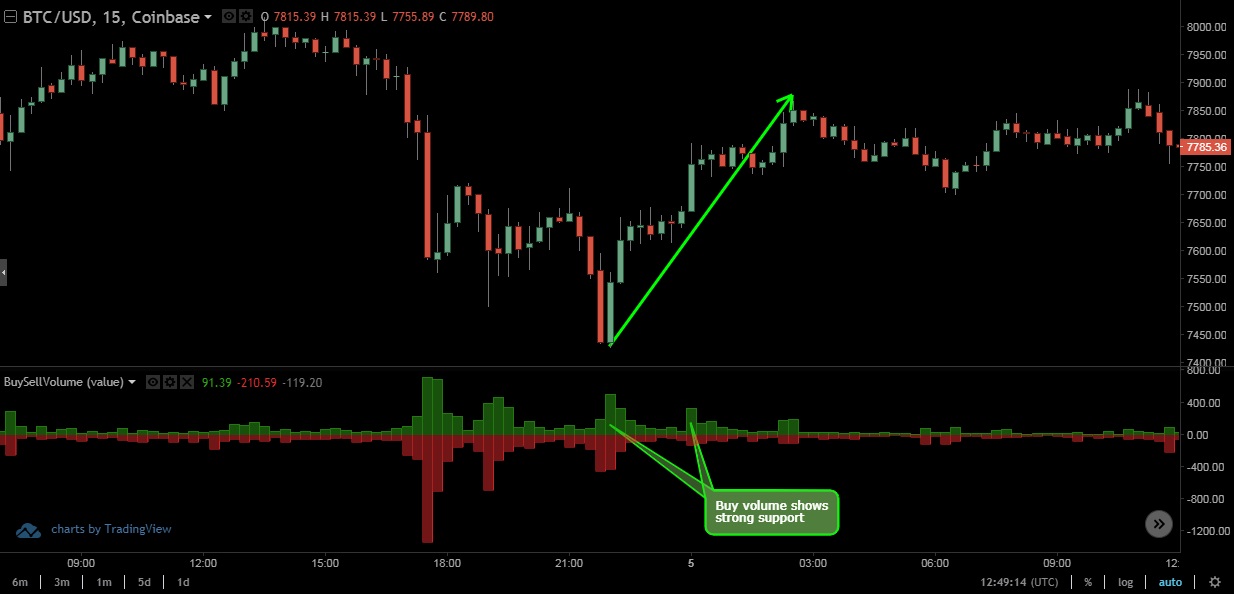
In the 15-minutes Coinbase BTC/USD chart above, we can see how the overwhelmingly high buy volume near the bottom can predict the reversal in the price movement. Once the Bitcoin price hits $7426, buyers see the opportunity and “outscore” sellers in volume, which is clearly depicted by the indicator. As a result, the price is pushed up to $7881, making it possible for the skillful traders to record a profit of 6% during the period of only four hours.
Now, let’s see what preceded that movement.
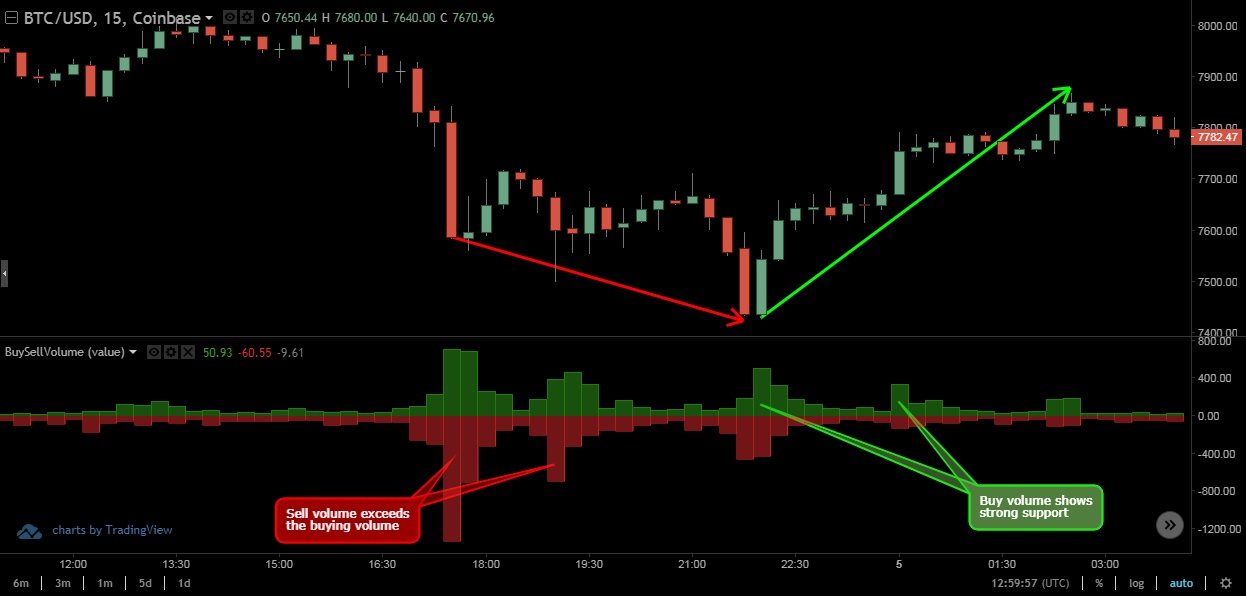
The second chart example shows how buy vs sell volume can reveal the potential for the negative price movement. As can be seen, it is obvious that the selling pressure is getting too high for the price to withstand its value and declines further towards the mentioned $7426.
For those unaccustomed to bars, there is a percentage option which shows which way the pressure is going even more in detail.
Looking at the next chart showing buy vs sell volume as percentages, we can even clearly spot divergences which can announce the changing market sentiment.
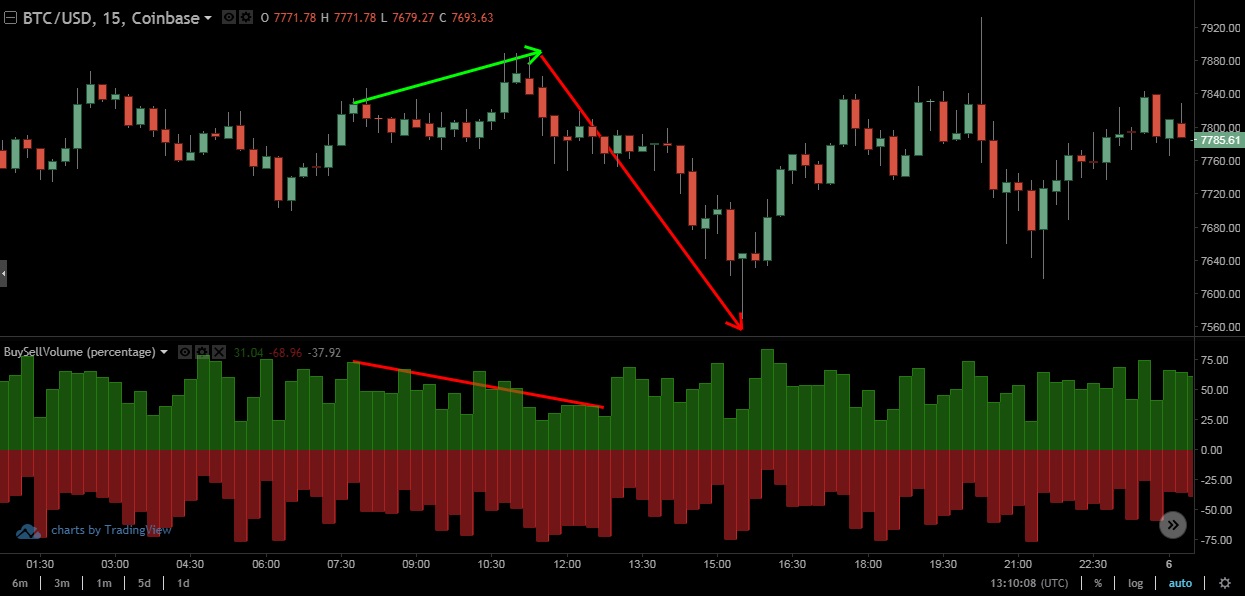
It is evident that, while the price of BTC in this BTC/USD 15-minutes chart is slightly growing, the buy volume is declining from 72% to 36%, making a divergence clearly visible. The only logical thing for the price is to start plummeting as the selling pressure pushed it down.
Combining with other indicators
As always, experienced traders cannot fully rely on a single indicator to make an educated decision. It is, therefore, advisable to combine the buy vs sell volume indicator with another one which a trader has already mastered.
As an example, we shall take the following BTC/USD daily chart, which, by combining the mentioned indicator with RSI, could reveal a trend reversal.
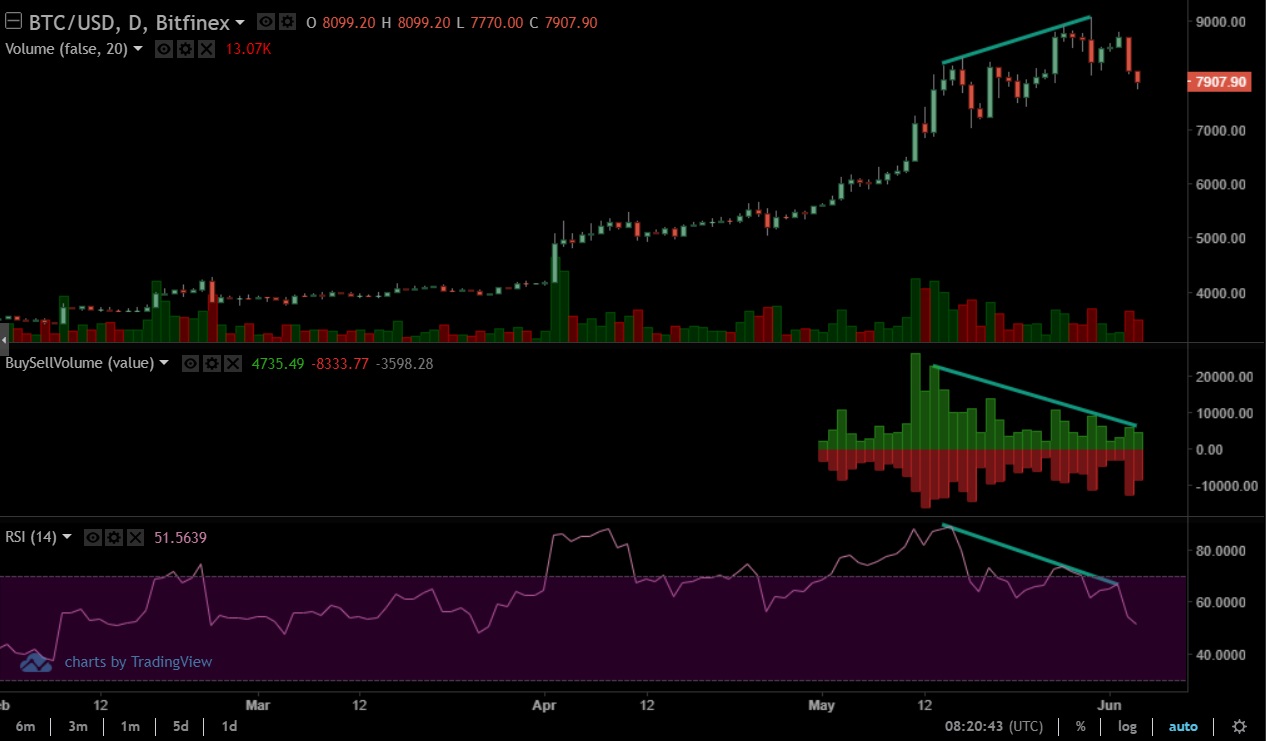
The decline in buying volume complements the falling value of the RSI indicator while the price keeps rising. Usually, this, in the majority of cases, means that the value of the crypto asset is going to drop.
Of course, RSI isn’t the only indicator that can be combined with buy vs sell volume. We can also combine it with buy vs sell count. However, in order to explain that, we have to explain the second technical tool first.
Buy vs sell count
Buy vs sell count shows the exact number of buy and sell orders which were executed in a predetermined timeframe on the exchange. Just like buy vs sell volume indicator, traders can view it in number ratio or percentage.
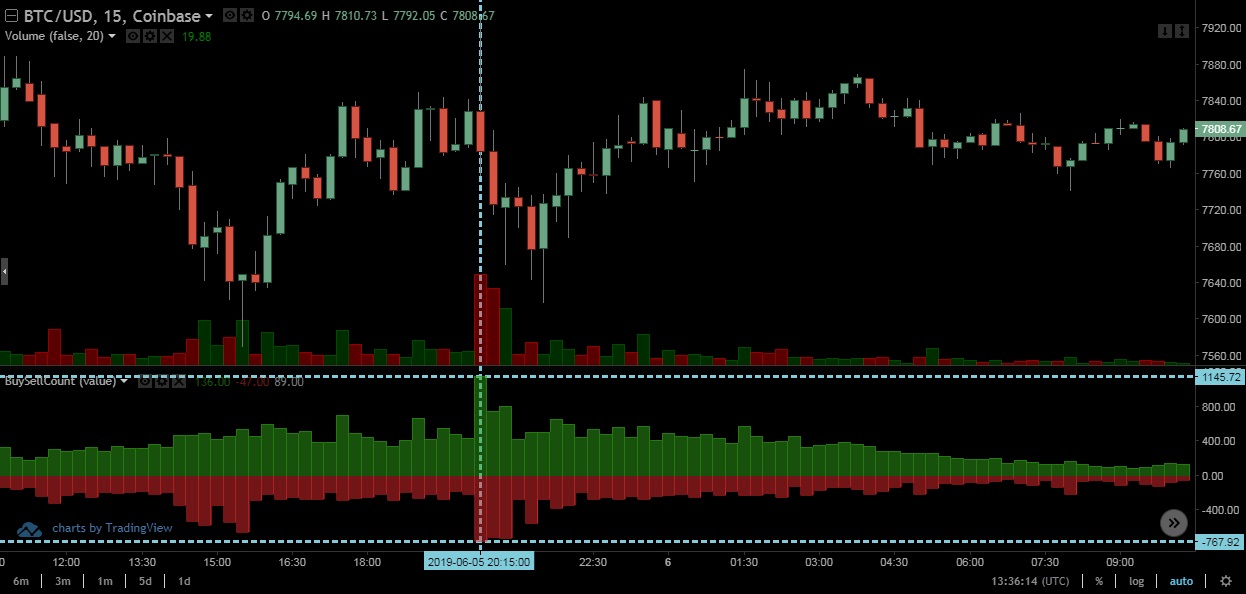
The BTC/USD chart above reveals how, during the 15 minute period marked by the vertical line, 1145 buy orders and 767 sell orders were executed.
The difference between the two indicators
Buy vs sell count indicator is important for traders because volume and count may not always correlate as one huge market order can outweigh a big number of smaller orders in volume but will impact the price only one time.
For example, let’s say that in a 15-minutes timeframe only one 6000 BTC market sell order is executed but, in the meantime, 6000 market buy orders, each for 1 BTC, went through. In that instance, the green and red bars in buy vs sell volume indicator are going to be exactly the same. However, in buy vs sell count, the green bar is going to be 6000 times bigger than the red bar.
Therefore, while the volume indicator shows the amount of cryptocurrency traded, the count indicator depicts the exact number of sellers and buyers on the exchange.
Since these two can largely differ depending on the situation, it is best to use them as complementary trading indicators.
Combining the two
Since we have learned that using only one indicator can often be misleading, we will use an example to portray how the two indicators explained today can paint a much clearer picture of market conditions.
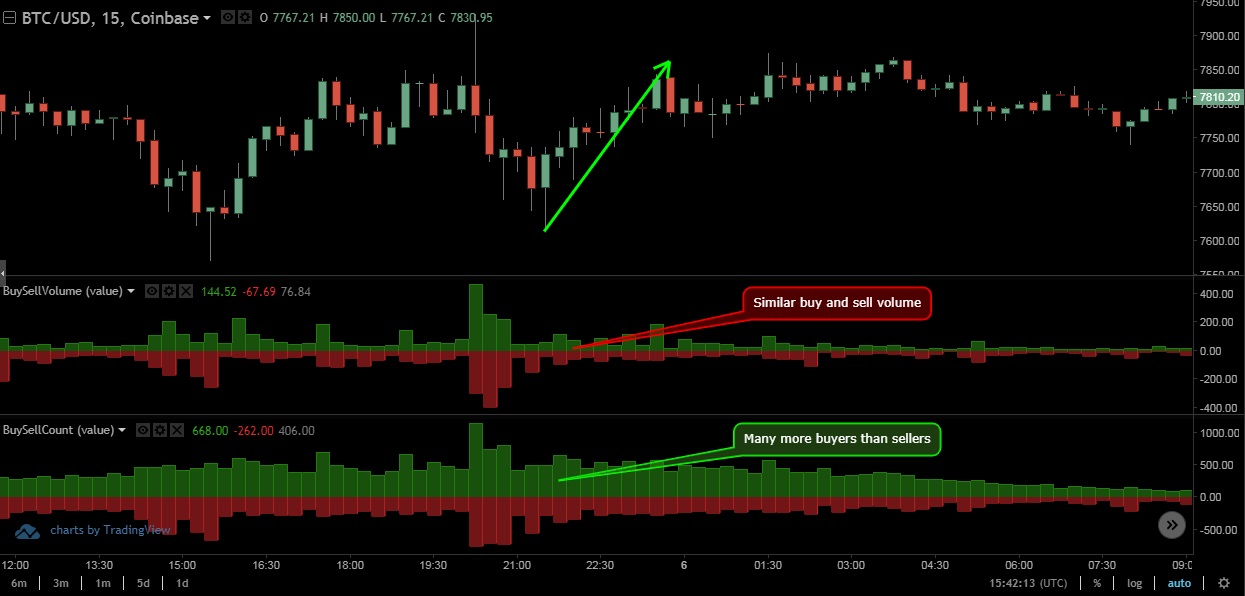
The Coinbase BTC/USD 15-minutes chart above shows that the price of Bitcoin has, between 9:30 PM and 11:30 PM, climbed from $7,615 to $7,842 despite buy vs sell volume bar indicator not reflecting that change. By looking at the buy vs sell count indicator, we can simply deduce that the price was driven by a much bigger number of buyers placing smaller buy orders.
However, as we are about to show you, this thing may not be positive at all.
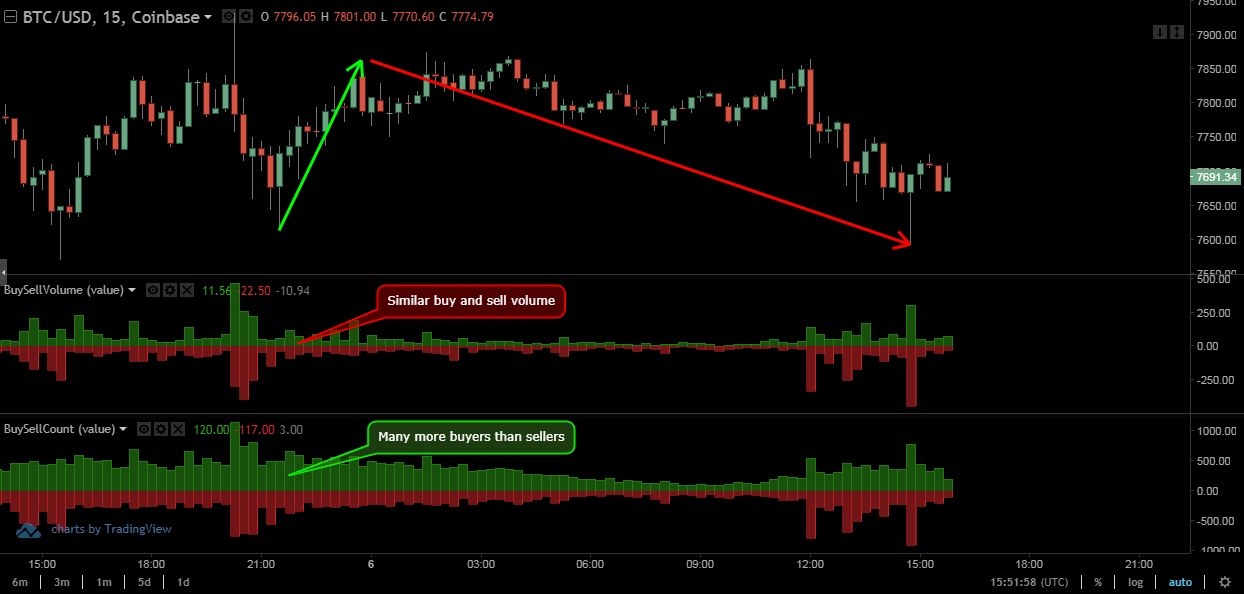
Above is the extension of the previous chart which reveals that, since there wasn’t enough volume to prolong the short-term positive price movement, the traders’ sentiment changed, in turn pushing the price back down.
Conclusion
The two elaborated indicators are very useful tools in predicting market movement. However, being aware of what they mean is a completely different thing from implementing that knowledge to be an effective trader. Therefore, they work best along with other technical indicators such as the RSI, MACD, or even moving averages.
So, like in other aspects of life, do not underestimate the power of knowledge when it comes to crypto trading.
Until the next time, trade responsibly.
Disclaimer: This article is not investment advice. Note that cryptocurrencies are highly volatile assets and very risky investments. Do your research or consult an investment professional before investing. Never invest more than you can afford to lose. Never borrow money to invest in cryptocurrencies.