Despite the undeniable simplicity of trading volume indicator, in this article, we are going to reveal how traders can utilize it to enhance their profits and lower the risk of investment.
Volume indicator shows traders how much of certain cryptocurrency has been traded during the predefined timeframe.
Comparing volumes across a short-term pattern can tell traders if the interest in cryptocurrency is rising or falling. However, analyzing volumes through a longer period of time can sometimes be pointless as the overall conditions of the markets are also incomparable. Still, we are going to explain how to put volume in service of long and short-term trading.
Therefore, this article will explain how volume indicator can help traders spot:
- Rising/falling market interest
- Exhaustion moves
- Price reversals
- Breakouts/false breakouts
Rising/falling market interest
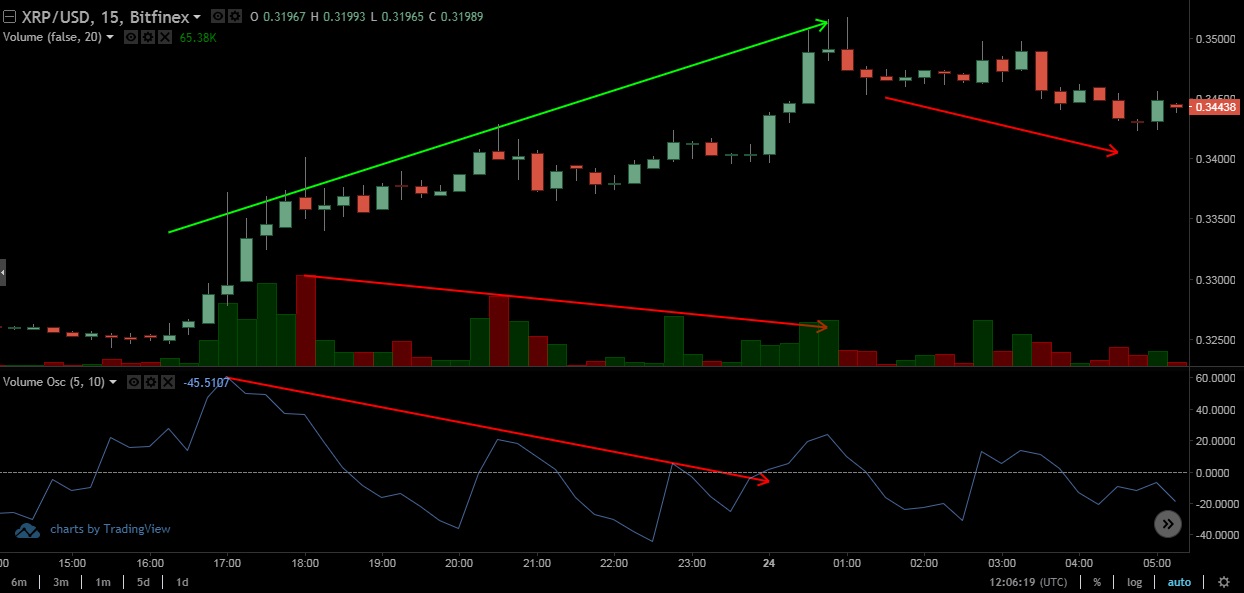
Sometimes, in the highly volatile cryptocurrency market, the price of the cryptocurrency is rising while the trading volume is declining, which clearly marks that buyers interest is fading.
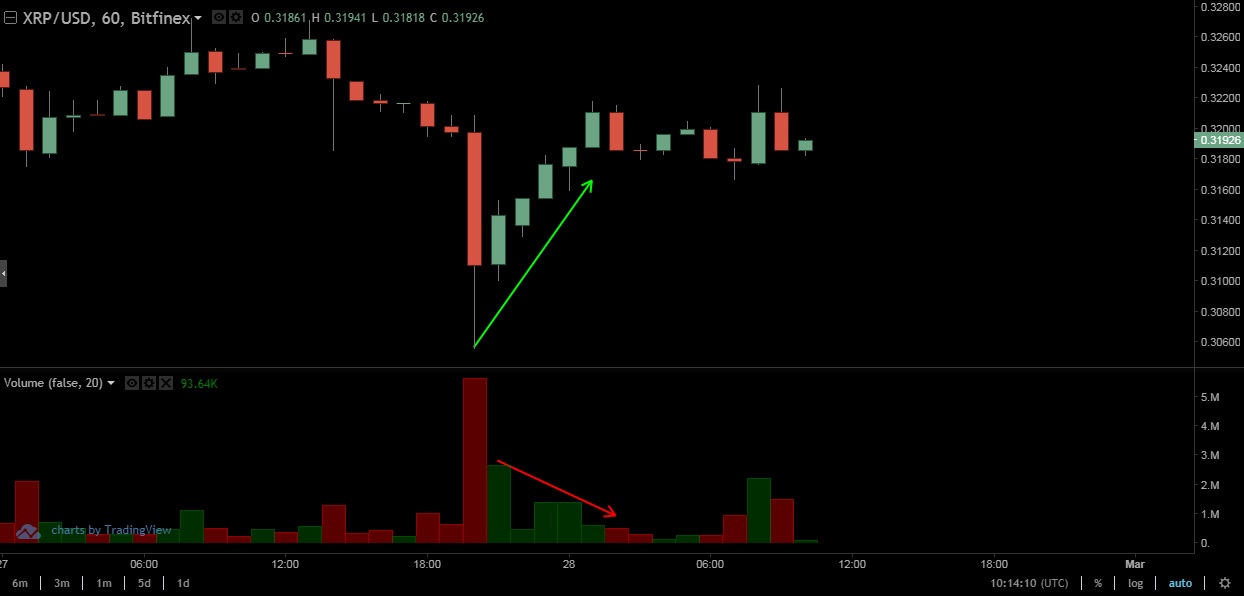
The XRP / USD chart above shows one such (most recent) occasion, where XRP is rebounding. However, the volume doesn’t follow this short-term price movement, indicating that the bullish trend isn’t going to last.
Exhaustion moves
Every market trend which lasts for a longer period of time can lead to exhaustion of buyers or sellers.
Simply put, as the trend lasts, the number of people willing to buy/sell a cryptocurrency gets smaller until there are no traders willing to buy/sell.
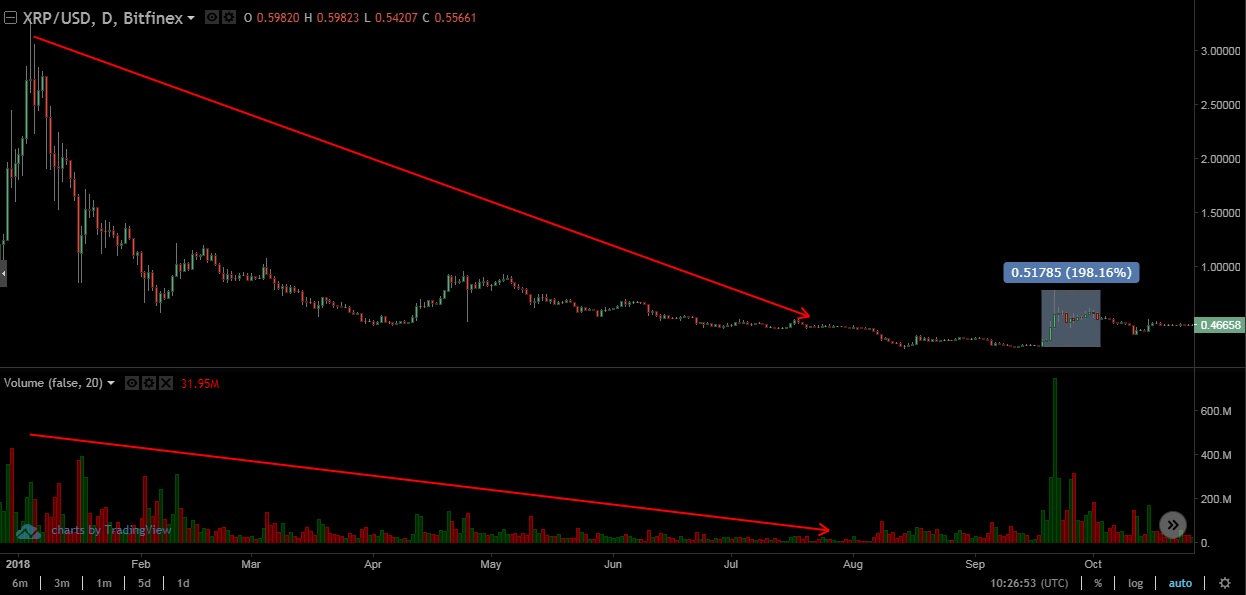
The XRP/USD chart above shows how during the prolonged 2018 bear market, Ripple (XRP) witnessed the constant decline of volume, slowly exhausting the number of sellers. That resulted in really low volumes in late August, naturally, followed by a sudden burst in volume and price.
It is obvious how traders could deduce that, after exhausting the number of sellers, it was time to invest and ride the short-term wave, which could have resulted in a 200% profit.
False breakout
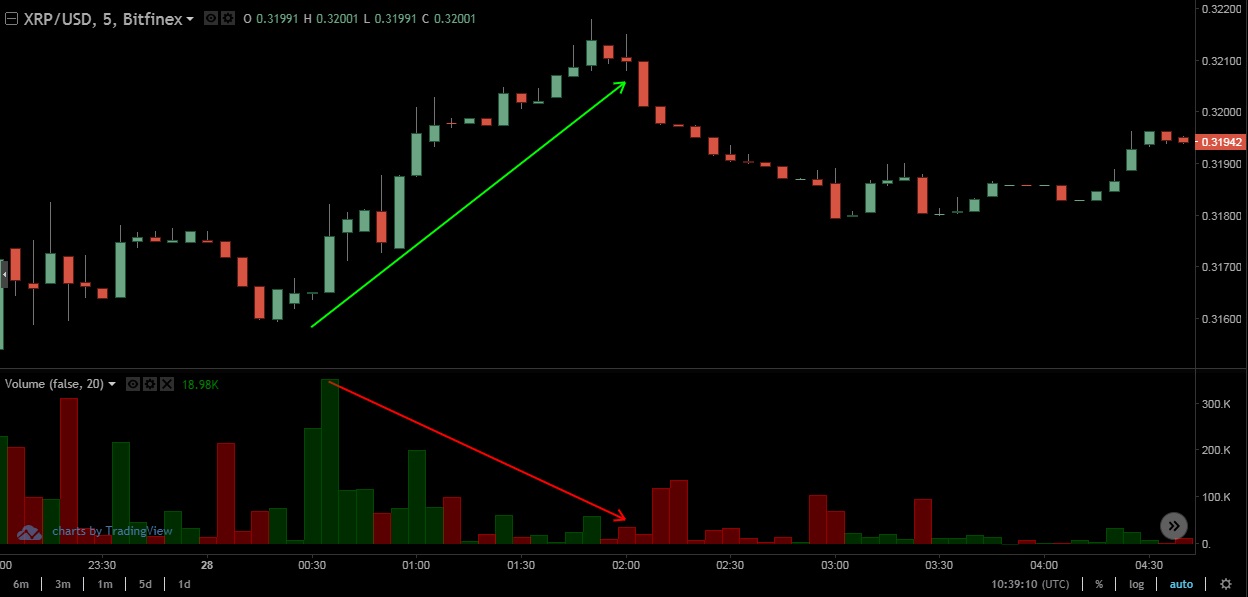
The XRP/USD chart above is an explicit example of volume indicating a false breakout.
Ripple’s price can show signs of hope for a breakout, while at the same time the volume tells a story of its own, with a clear signal that the interest of investors isn’t high enough to push the price higher, revealing that the breakout is false.
Price reversals
Those who didn’t spot the price reversal in January 2018, may still suffer consequences in terms of losses generated by wrong decisions.
Therefore, we are going to explain how volume can reveal that the long-term trend is coming to an end.
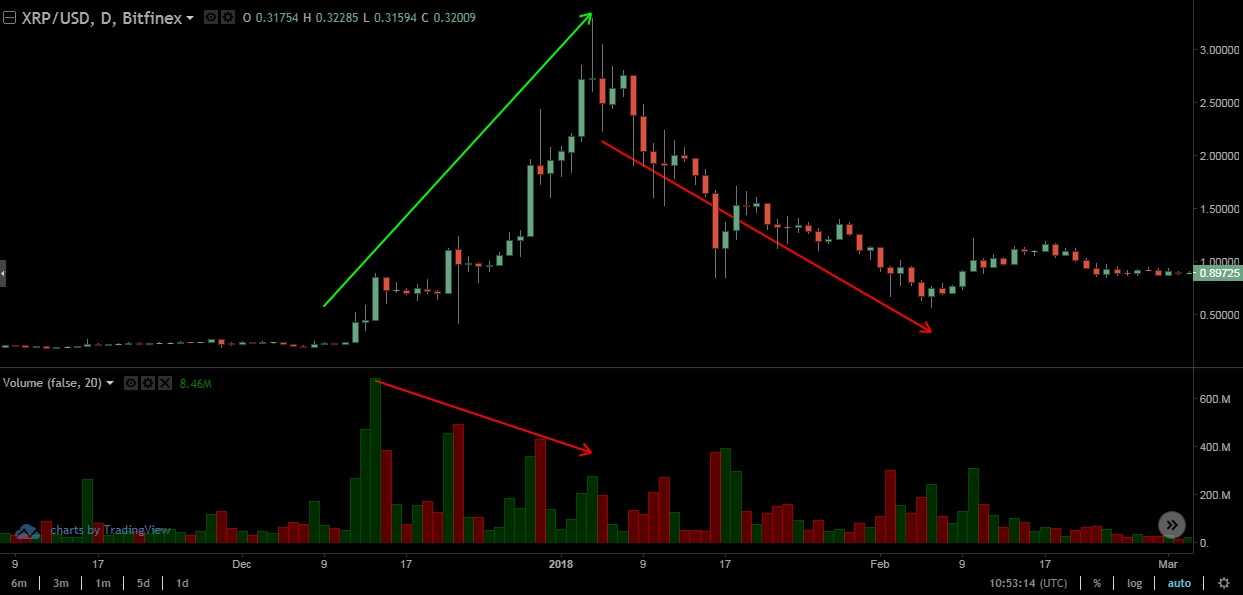
The XRP/USD chart reveals that, while all investors were excited with the “greatest bull run ever”, the trading volume was constantly declining as the price of the cryptocurrency was reaching its all-time high.
The reversal was inevitable as there were no new investors to carry the momentum anymore.
As we can see, although it is definitely the simplest of tools, volume can be utilized to help traders make more educated decisions. Furthermore, there are some volume-related indicators that can have even more impact on your trading.
Volume-related indicators
Those volume-related indicators are:
- On-balance volume (OBV)
- Chaikin money flow
- Klinger oscillator
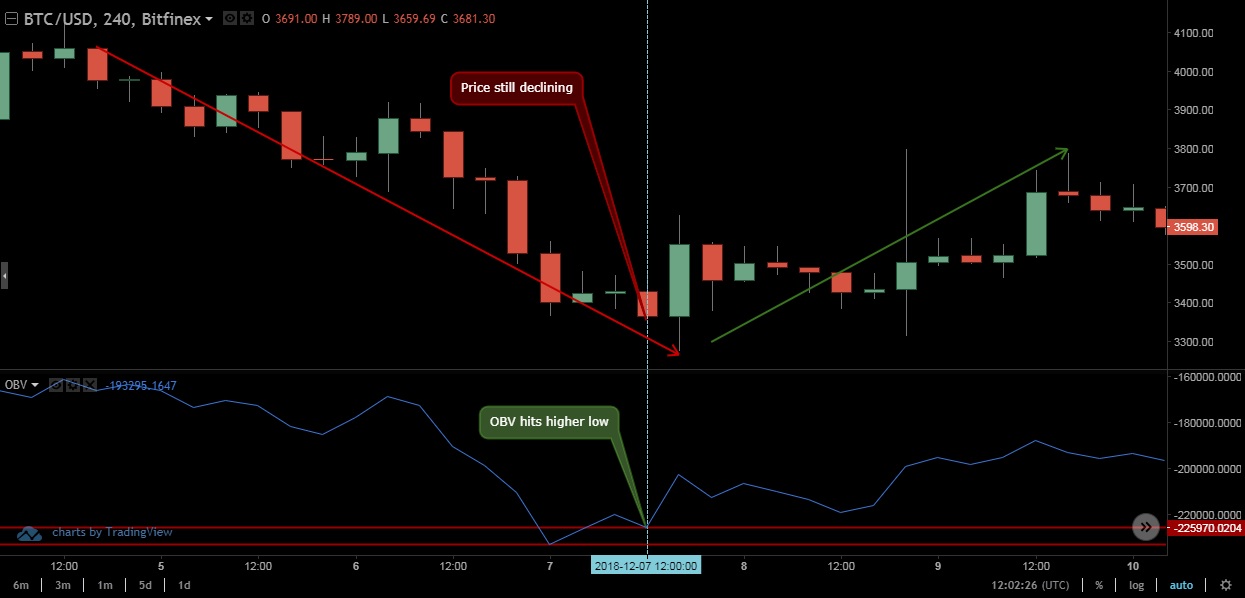
On-balance volume (OBV)
In OBV, the volume is added or subtracted from the arbitrary number when the market finishes higher or lower, which provides a running total, showing if a cryptocurrency is being accumulated.
Moreover, OBV can be used to spot divergences that reveal trend reversals just like in the chart below.
If you want to learn more, refer to our article about trend trading.
Chaikin money flow
Chaikin money flow method concentrates on expanding volume win cases when prices finish in the upper or lower part of the daily range. It then presents value for the strength of the trend.
During the instances when the indicator travels in the upper division of the range accompanied by the rising volume, values have a tendency to be high. On the other hand, if the opposite happens, the value is negative.
Chaikin money flow can also be used to spot divergences.
The short-term XRP/USD chart above clearly shows how, while the price was hitting higher highs, the volume didn’t follow, which was confirmed by the Chaikin money flow, revealing a divergence in the price action.
Analogically, the reversal happened as there wasn’t enough volume to keep the trend.
Klinger oscillator
Klinger oscillator consists of two lines. A “signal” line (green in the char), which is used to trigger buy and sell signals, and the “plot” line (blue in the chart), which is, in fact, the oscillator.
Klinger oscillator can reveal strong buy and sell signals once the two lines cross over each other, in a similar way to what happens with moving averages.
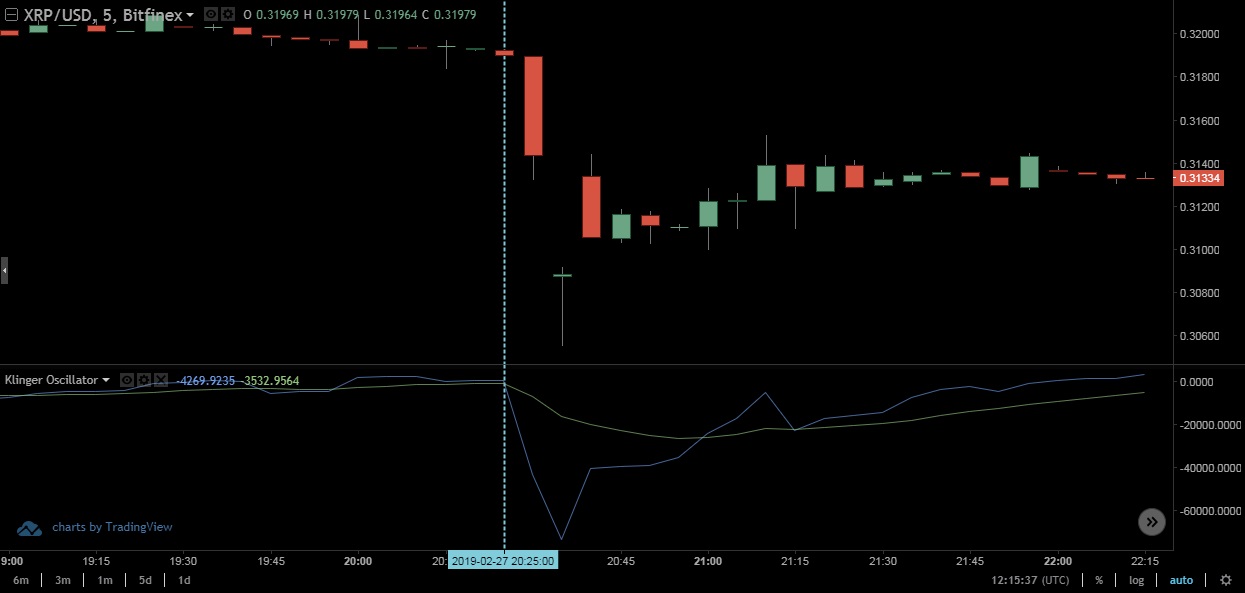
The XRP/USD chart above shows how the Klinger oscillator provided the sell signal at the right moment for traders not to suffer heavy losses as the “plot” line dropped suddenly below the signal.
While the Klinger oscillator uses a quite complicated calculation to provide such signals, it is fairly simple to use, so, just like many other indicators, it can be also used to spot divergences like in the chart below.
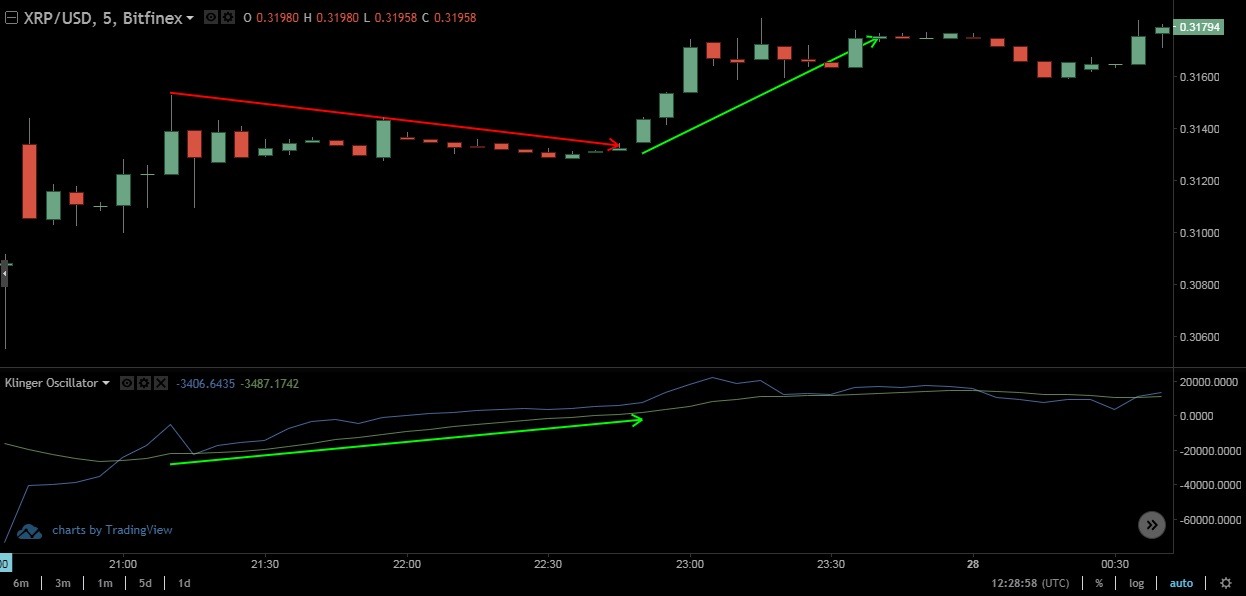
While the price of Ripple slowly declines, the Klinger oscillator denies that movement, which eventually reverses the trend.
This article shows how the simplest of indicators can be very useful tools in the bumpy cryptocurrency trading ride.
Traders should look to utilize everything at their disposal to assist their strategy and technique, so we hope that we have broaden horizon with this article at least a bit.
Until the next part of our tutorial, trade responsibly.
Disclaimer: This article is not investment advice. Note that cryptocurrencies are highly volatile assets and very risky investments. Do your research or consult an investment professional before investing. Never invest more than you can afford to lose. Never borrow money to invest in cryptocurrencies.